Fig. C.1.
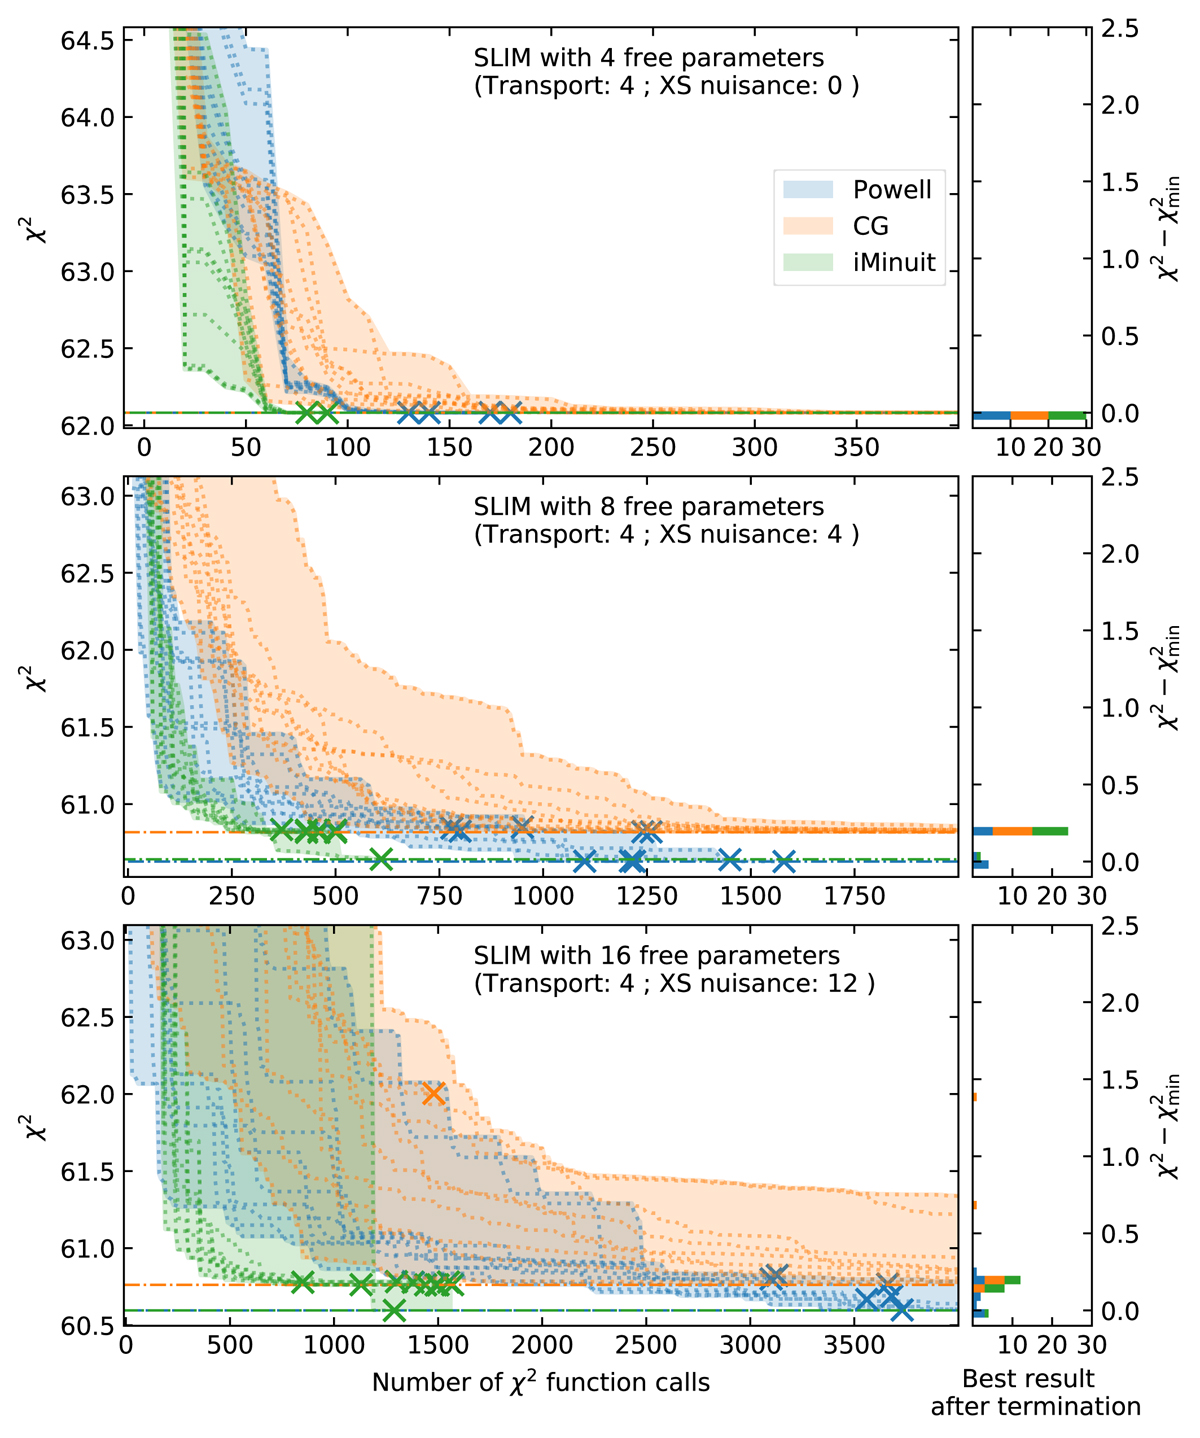
Comparison of minimiser convergence speed and robustness. The dotted lines show the χ2 progress towards its minimum as a function of the number of calls, until the algorithm stops (cross symbol). Several algorithms are shown, namely Powell (blue), GC (red), and MINUIT (green), and the horizontal dash-dotted lines highlight the best-fit obtained for each algorithm. Ten different starting points are run, and the distribution of the best ![]() found are projected on the right-hand panel to show that sometimes the algorithm is stuck in a local minimum. From top to bottom: number of nuisance parameters in the model increases. See text for discussion.
found are projected on the right-hand panel to show that sometimes the algorithm is stuck in a local minimum. From top to bottom: number of nuisance parameters in the model increases. See text for discussion.
Current usage metrics show cumulative count of Article Views (full-text article views including HTML views, PDF and ePub downloads, according to the available data) and Abstracts Views on Vision4Press platform.
Data correspond to usage on the plateform after 2015. The current usage metrics is available 48-96 hours after online publication and is updated daily on week days.
Initial download of the metrics may take a while.