Free Access
Fig. A.3.
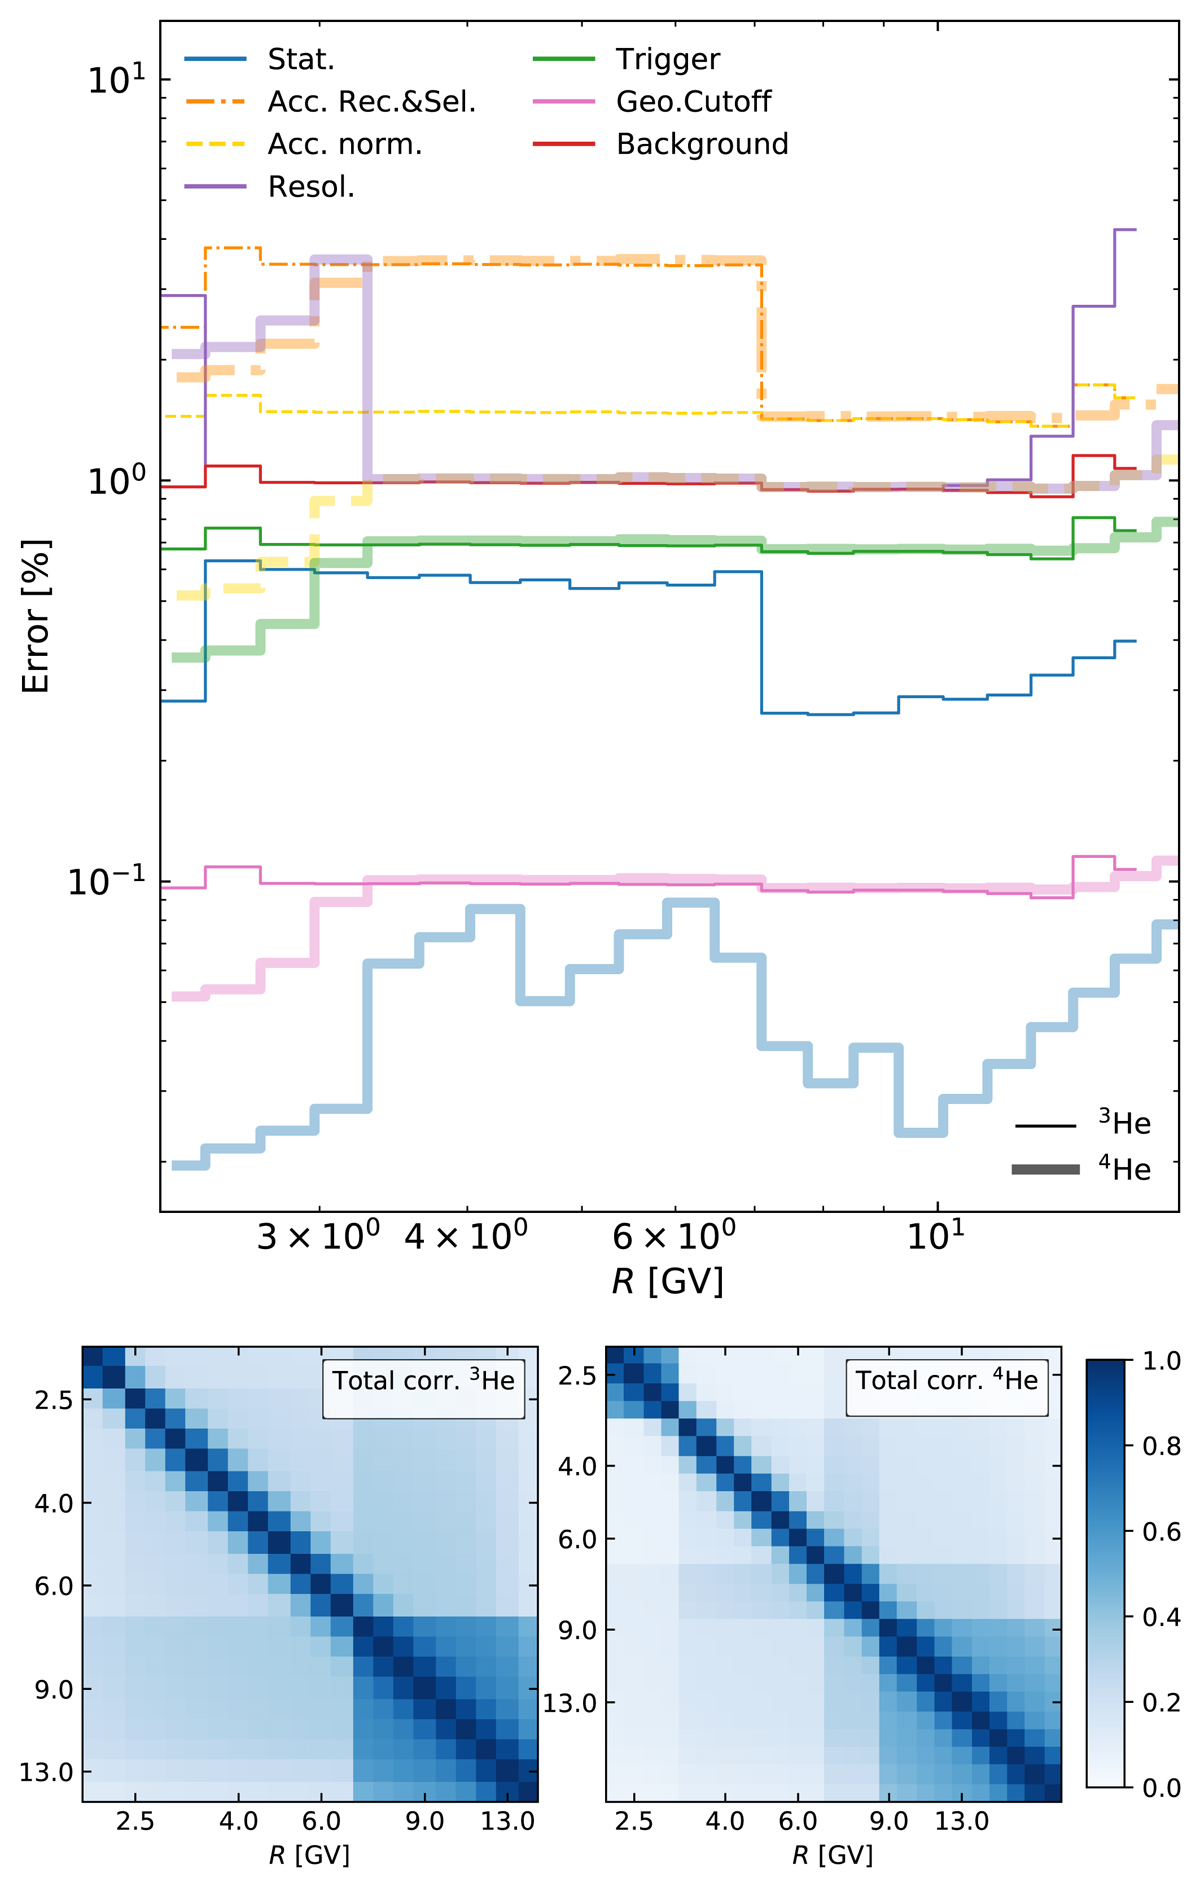
Top panel: comparison of statistical and systematic uncertainties for 3He (thin lines) and 4He (thick lines) AMS-02 data. Bottom panel: correlation matrix for 3He (left) and 4He (right) as a function of R. All quantities are reconstructed from Aguilar et al. (2019); see text for details.
Current usage metrics show cumulative count of Article Views (full-text article views including HTML views, PDF and ePub downloads, according to the available data) and Abstracts Views on Vision4Press platform.
Data correspond to usage on the plateform after 2015. The current usage metrics is available 48-96 hours after online publication and is updated daily on week days.
Initial download of the metrics may take a while.