Free Access
Fig. A.2.
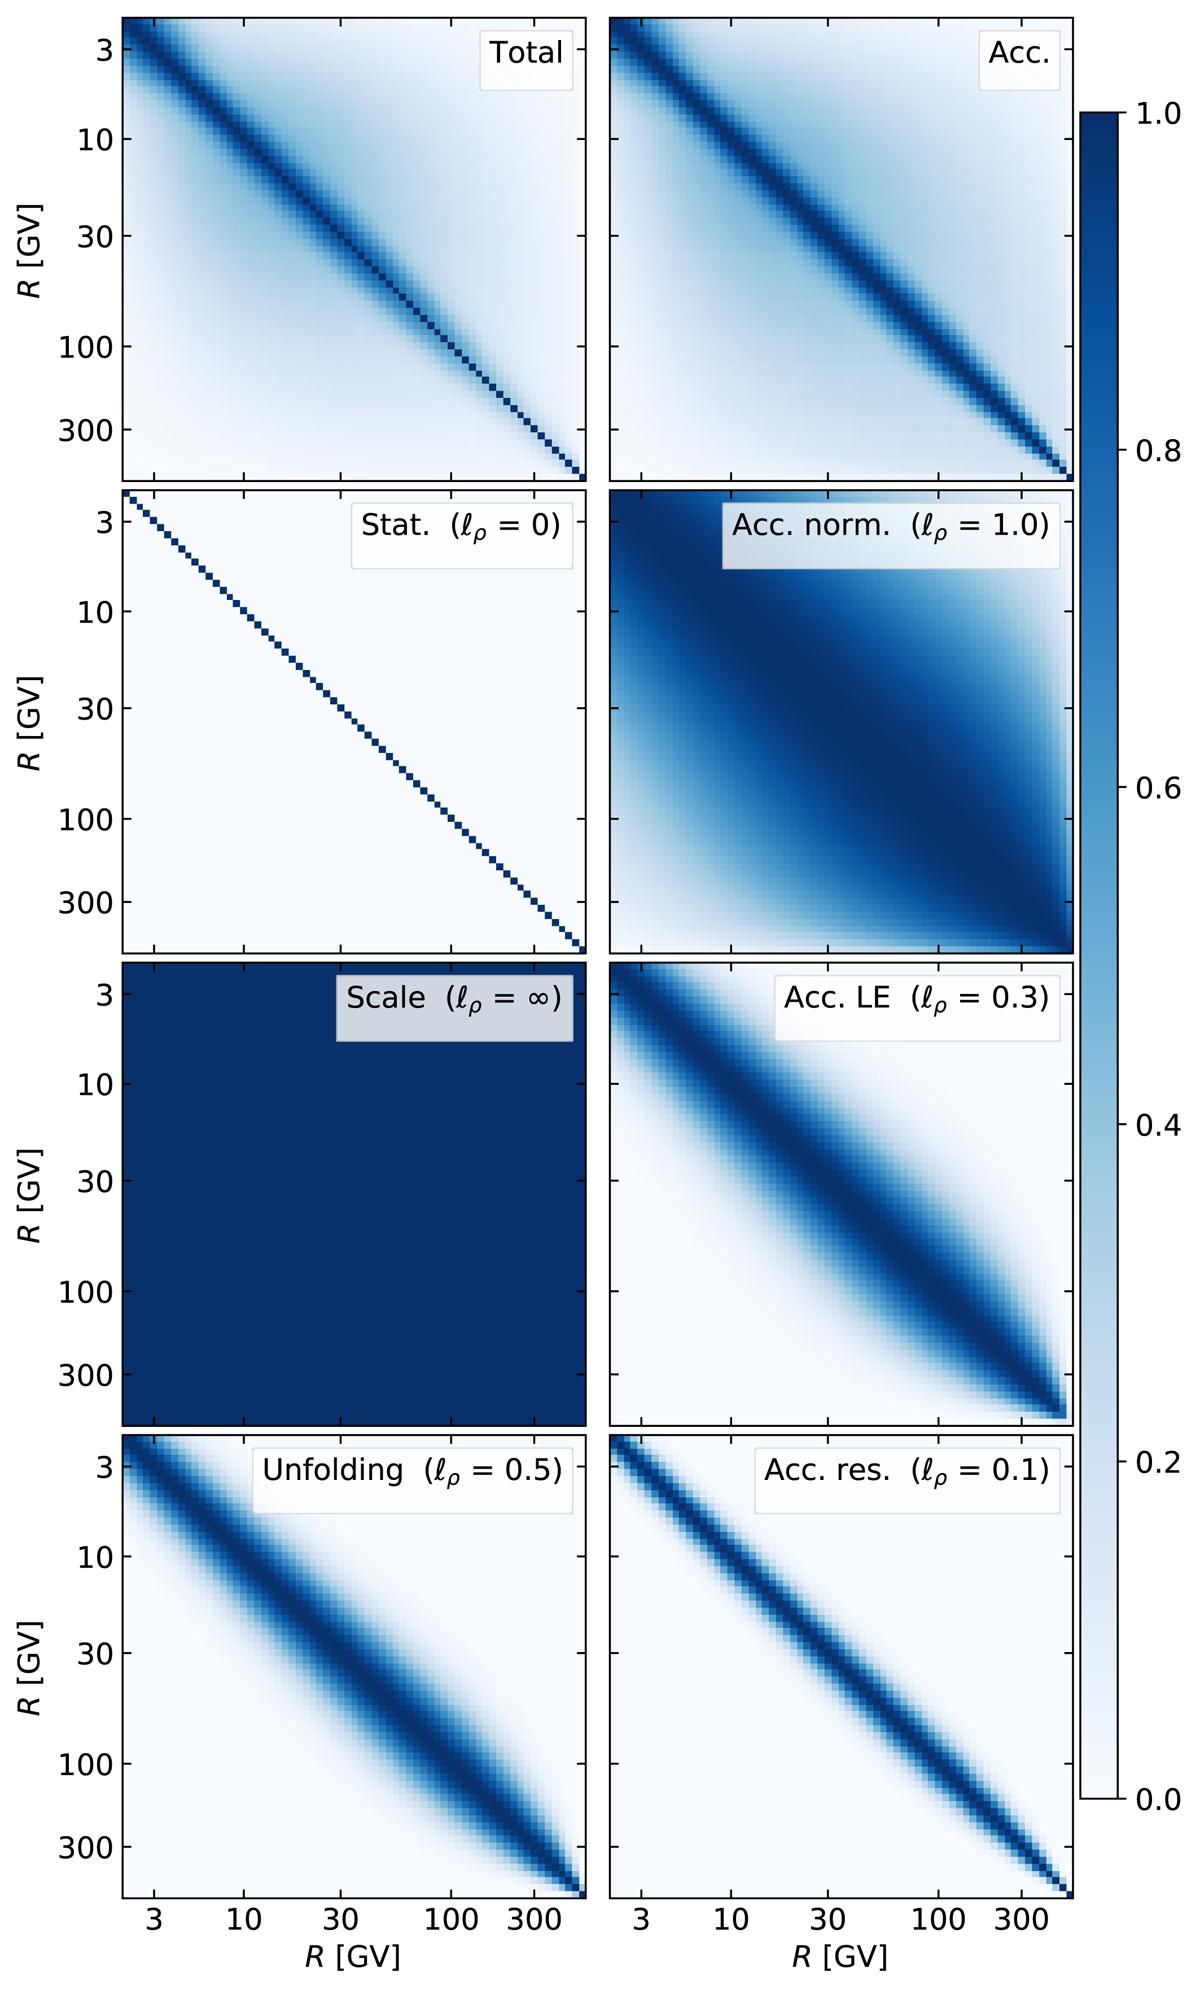
Correlation matrices colour-coded from zero (no correlation, white) to one (full correlations, blue). Three bottom panels: systematics whose amplitude are shown in Fig. A.1. Top right panel: correlation matrix from all acceptance uncertainties, top left panel: that from all uncertainties combined.
Current usage metrics show cumulative count of Article Views (full-text article views including HTML views, PDF and ePub downloads, according to the available data) and Abstracts Views on Vision4Press platform.
Data correspond to usage on the plateform after 2015. The current usage metrics is available 48-96 hours after online publication and is updated daily on week days.
Initial download of the metrics may take a while.