Fig. 2
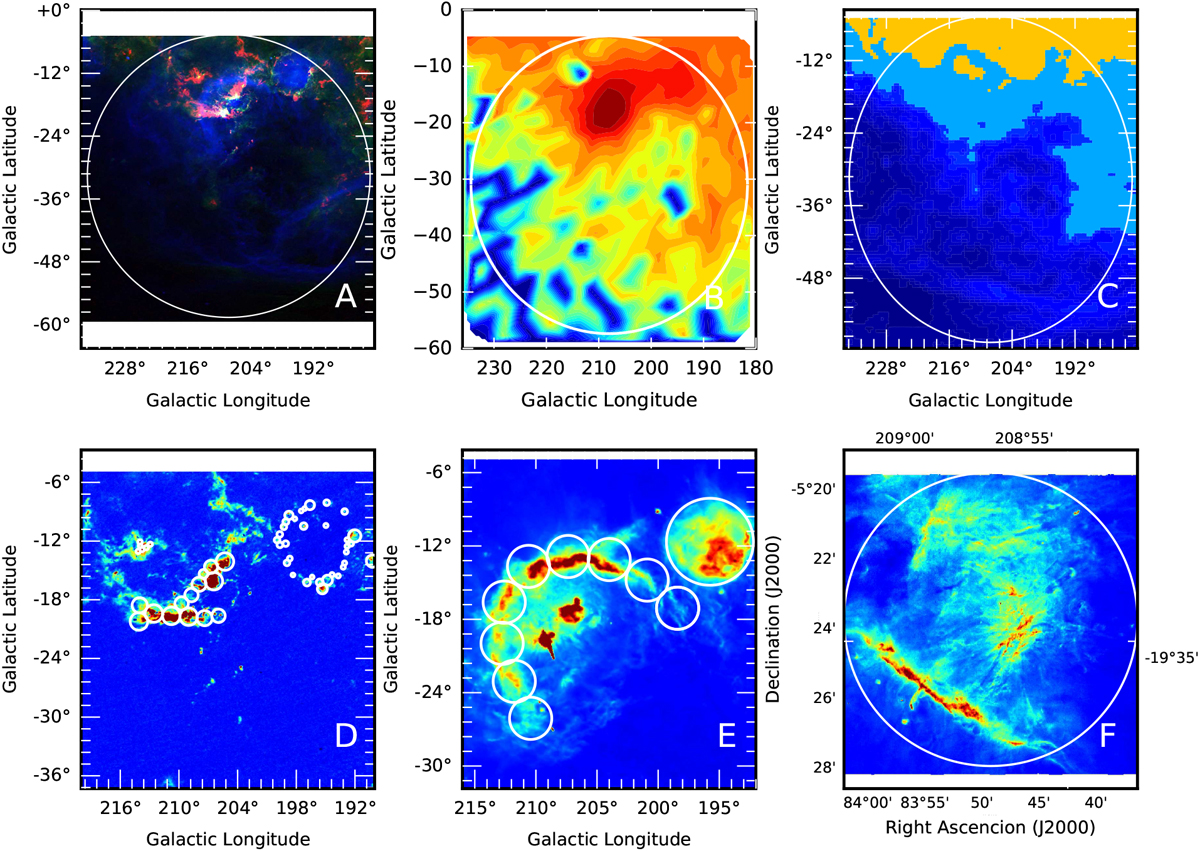
Orion-Eridanus region at different wavelengths. The color scale of these images has been manipulated to make the structures present stand out better. Panel A: overall Orion-Eridanus Region under study. Colors are as in Fig. 1. The [C II] COBE extraction aperture is shown as white circle with a physical extension of ~400 pc, taking 414 pc as average distance. Panel B: FIRAS COBE [C II] map and the extractionaperture as a white circle. Panel C: HI map integrated over the velocity range −40 km s−1 < νLSR < 40km s−1 (Brown et al. 1995). Panel D: CO(J = 2−1) map from Planck. The small white circles cover those parts of the four molecular clouds (Orion Molecular A & B, λ Ori, and Mon R2) and are used in our analysis (see also Figs. 4–6). Panel E: WIM extraction aperture for Barnard’s Loop and λ Orionis. The small white circles covering these two objects identify the apertures over which we performed our analysis. Panel F: extraction aperture of M 42 from Pogge et al. (1992) is shown in white circle. Each panel has different scale size.
Current usage metrics show cumulative count of Article Views (full-text article views including HTML views, PDF and ePub downloads, according to the available data) and Abstracts Views on Vision4Press platform.
Data correspond to usage on the plateform after 2015. The current usage metrics is available 48-96 hours after online publication and is updated daily on week days.
Initial download of the metrics may take a while.