Fig. 1
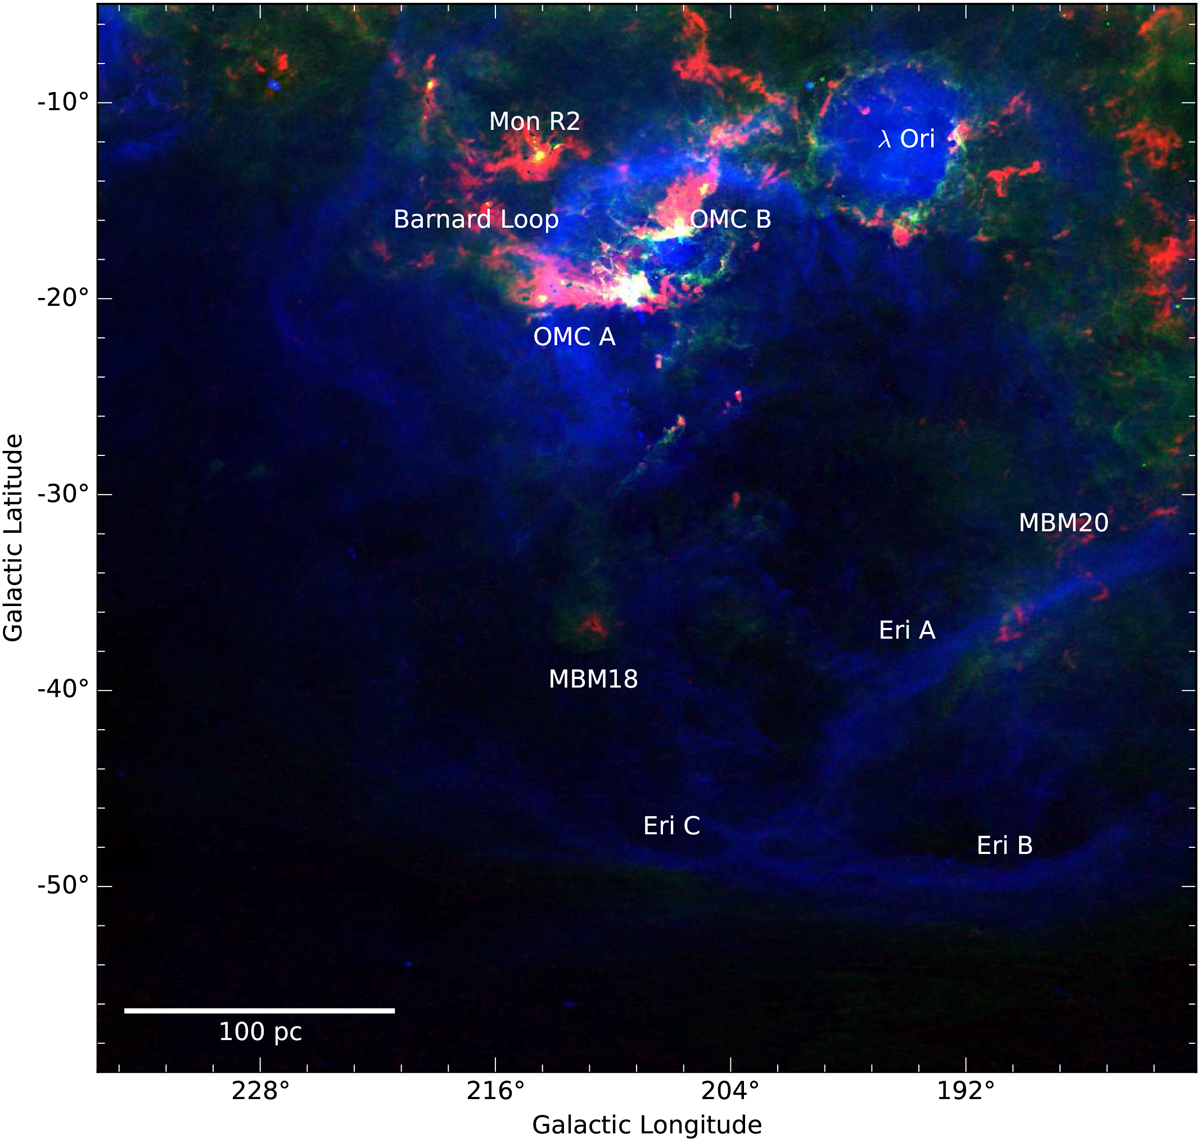
False-color image of the Orion-Eridanus Complex. The blue filter is Hα, tracing ionized gas, taken from the WHAM survey (Haffner et al. 2003), the green filter is the 12 μm map of WISE data (Wright et al. 2010), while the red filter is the Planck 857 GHz map (Planck Collaboration XI 2014). The scale size is 100 pc at the distance of M 42 (414 pc). We labeled some of the ISM gas component present on the aperture.
Current usage metrics show cumulative count of Article Views (full-text article views including HTML views, PDF and ePub downloads, according to the available data) and Abstracts Views on Vision4Press platform.
Data correspond to usage on the plateform after 2015. The current usage metrics is available 48-96 hours after online publication and is updated daily on week days.
Initial download of the metrics may take a while.