Fig. 9.
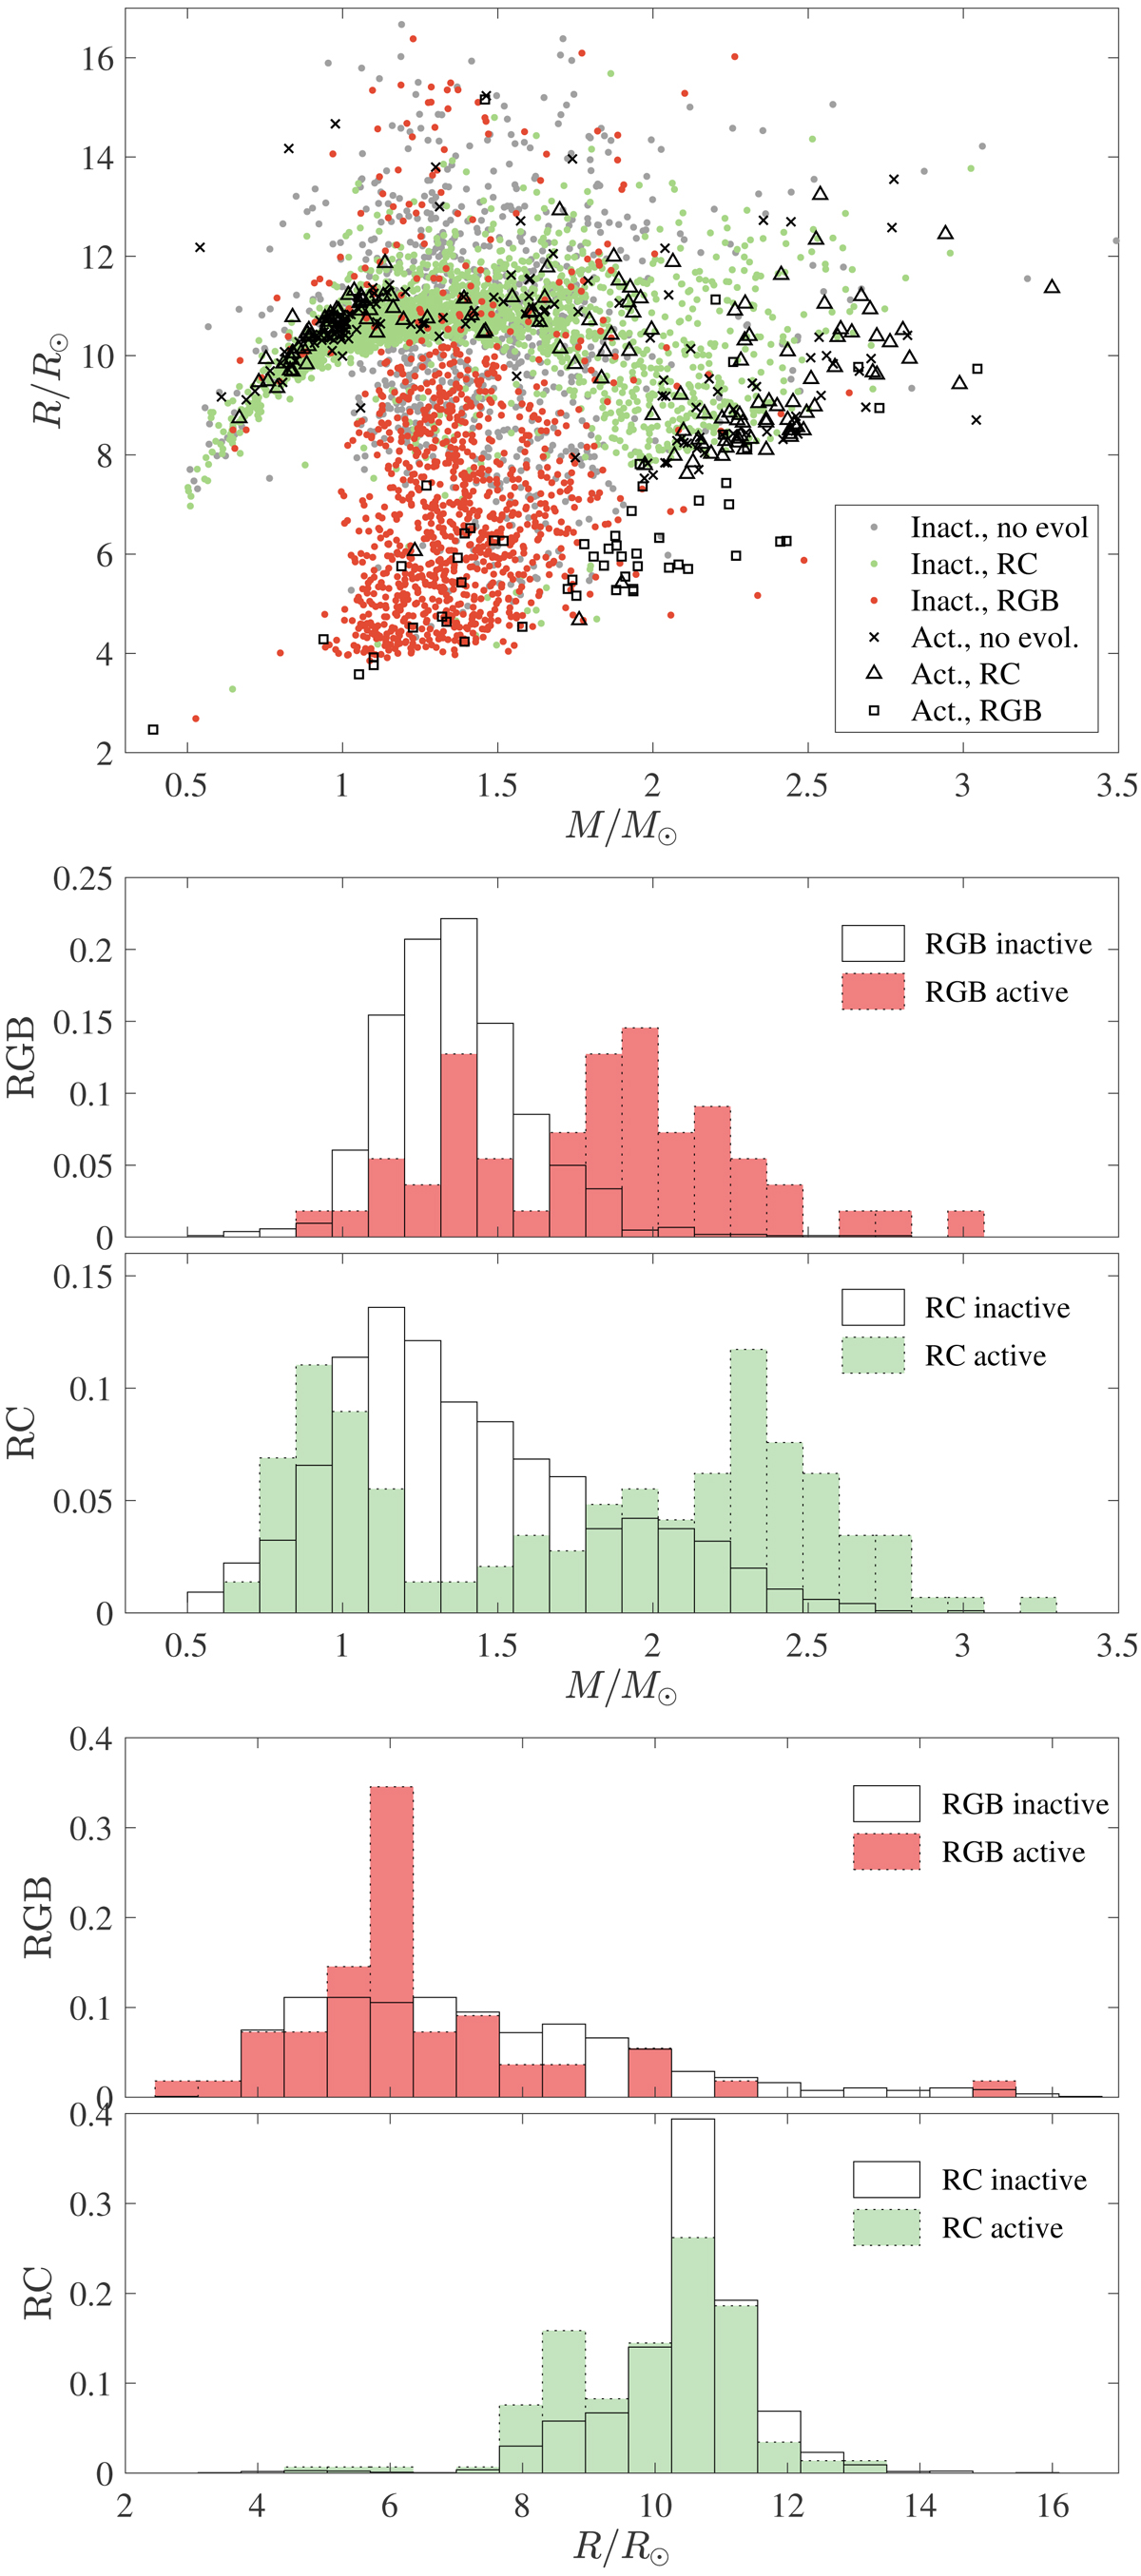
Top panel: radius versus mass of the sample of 4465 stars. Red dots indicate the inactive RGBs, green the inactive RCs, and gray the inactive with unknown evolutionary status. Black squares indicate active RGBs, triangles active RCs and × signs active RGs with unknown evolutionary status. Panels b and c: distributions of masses and radii of the inactive and active RG samples as a function of stellar masses (top two panels) and radii (bottom two), according to their evolutionary stages. Empty histograms correspond with the inactive samples, red with the active RGBs, and green with active RCs.
Current usage metrics show cumulative count of Article Views (full-text article views including HTML views, PDF and ePub downloads, according to the available data) and Abstracts Views on Vision4Press platform.
Data correspond to usage on the plateform after 2015. The current usage metrics is available 48-96 hours after online publication and is updated daily on week days.
Initial download of the metrics may take a while.