Fig. 6.
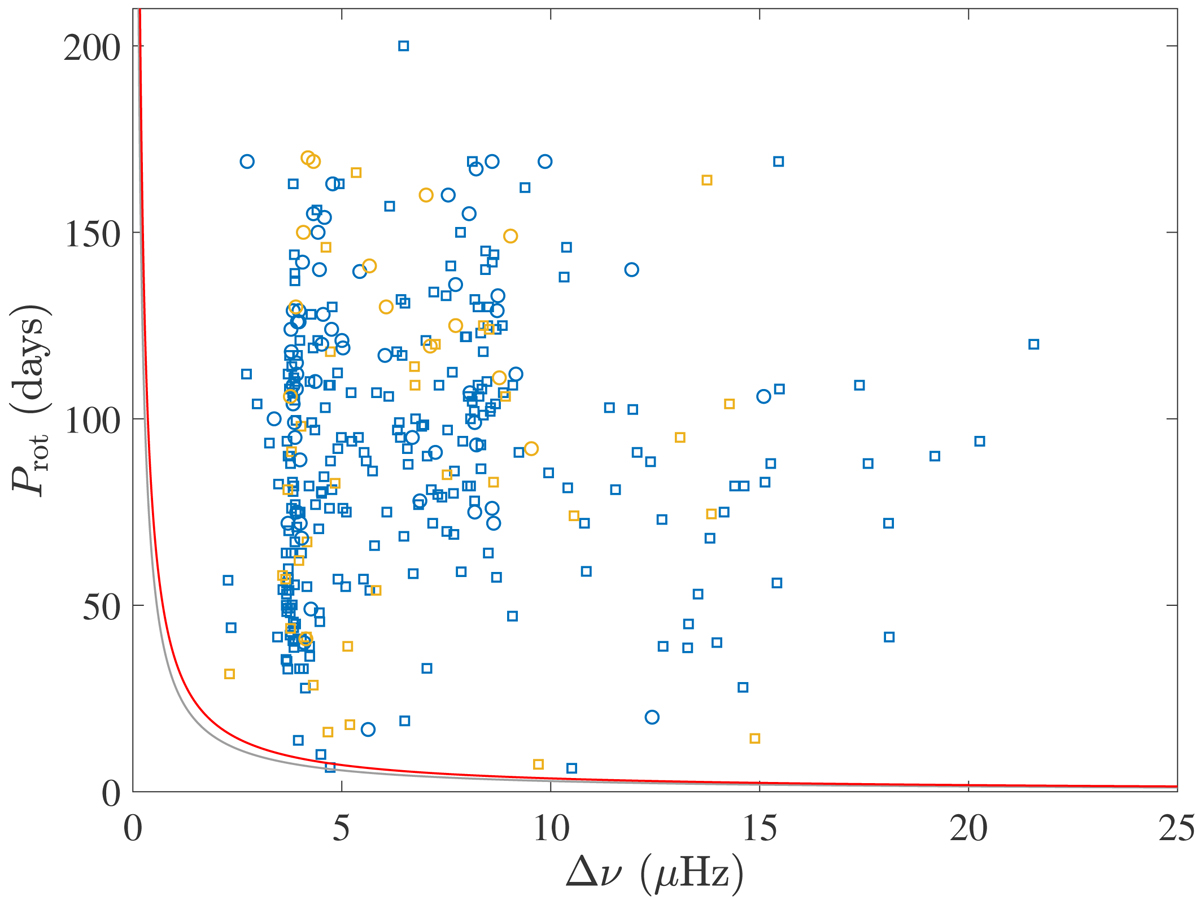
Rotation period Prot as a function of the mean large spacing Δν for RGs displaying both rotational modulation and oscillations. The gray line indicates the critical period Tcrit and the red line a rotational velocity of 80% of Tcrit. Blue squares are the RGs with clear rotational modulation, blue circles those with low S/N detection. Orange symbols indicate the same for those with crowding factor less than 0.98. This figure echoes Fig. 4 of Ceillier et al. (2017).
Current usage metrics show cumulative count of Article Views (full-text article views including HTML views, PDF and ePub downloads, according to the available data) and Abstracts Views on Vision4Press platform.
Data correspond to usage on the plateform after 2015. The current usage metrics is available 48-96 hours after online publication and is updated daily on week days.
Initial download of the metrics may take a while.