Open Access
Fig. 2.
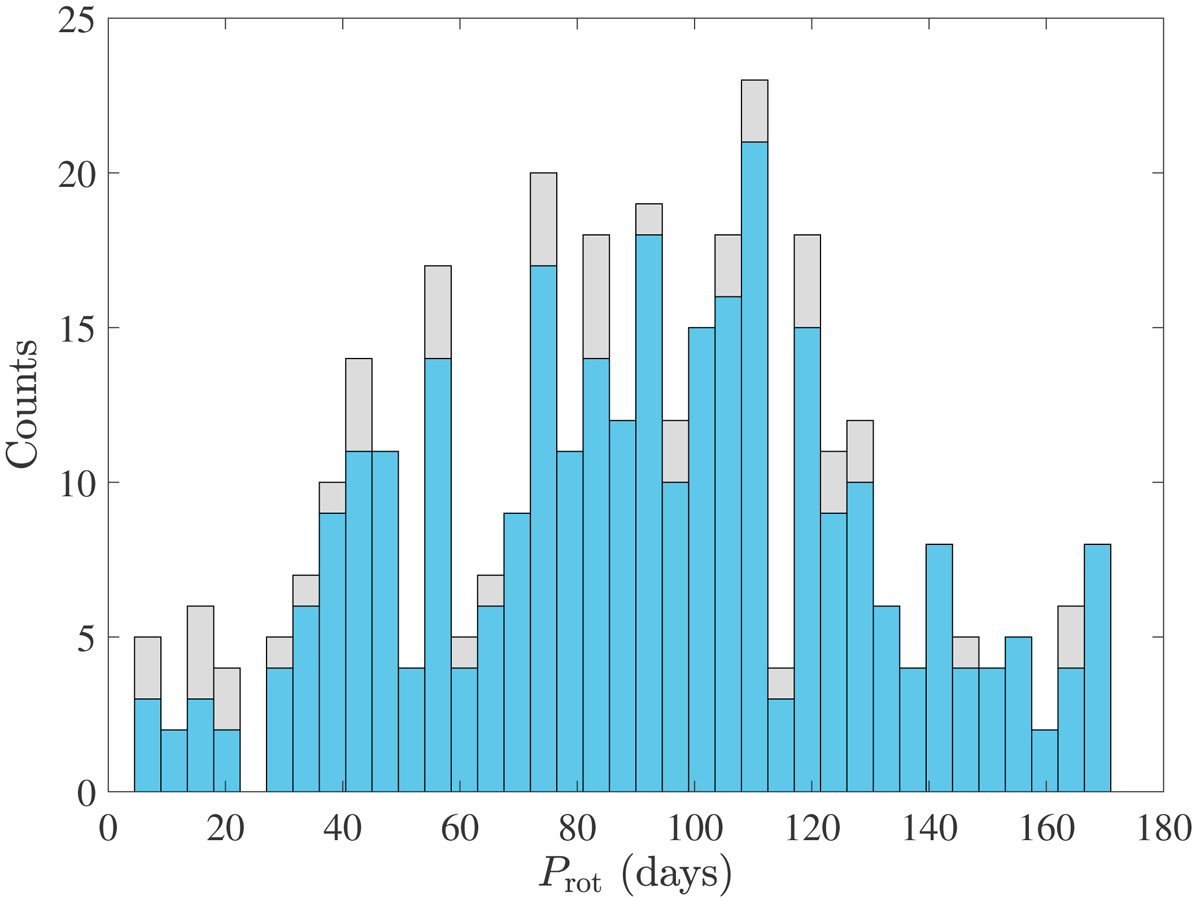
Histogram of the rotation periods Prot that we measure for 340 RGs where both oscillations and rotation are detected. The gray histogram includes all targets, whatever their crowding factor. The blue histogram includes only the 305 targets with crowding larger than 0.98. This figure echoes Fig. 5 of Ceillier et al. (2017).
Current usage metrics show cumulative count of Article Views (full-text article views including HTML views, PDF and ePub downloads, according to the available data) and Abstracts Views on Vision4Press platform.
Data correspond to usage on the plateform after 2015. The current usage metrics is available 48-96 hours after online publication and is updated daily on week days.
Initial download of the metrics may take a while.