Fig. 14.
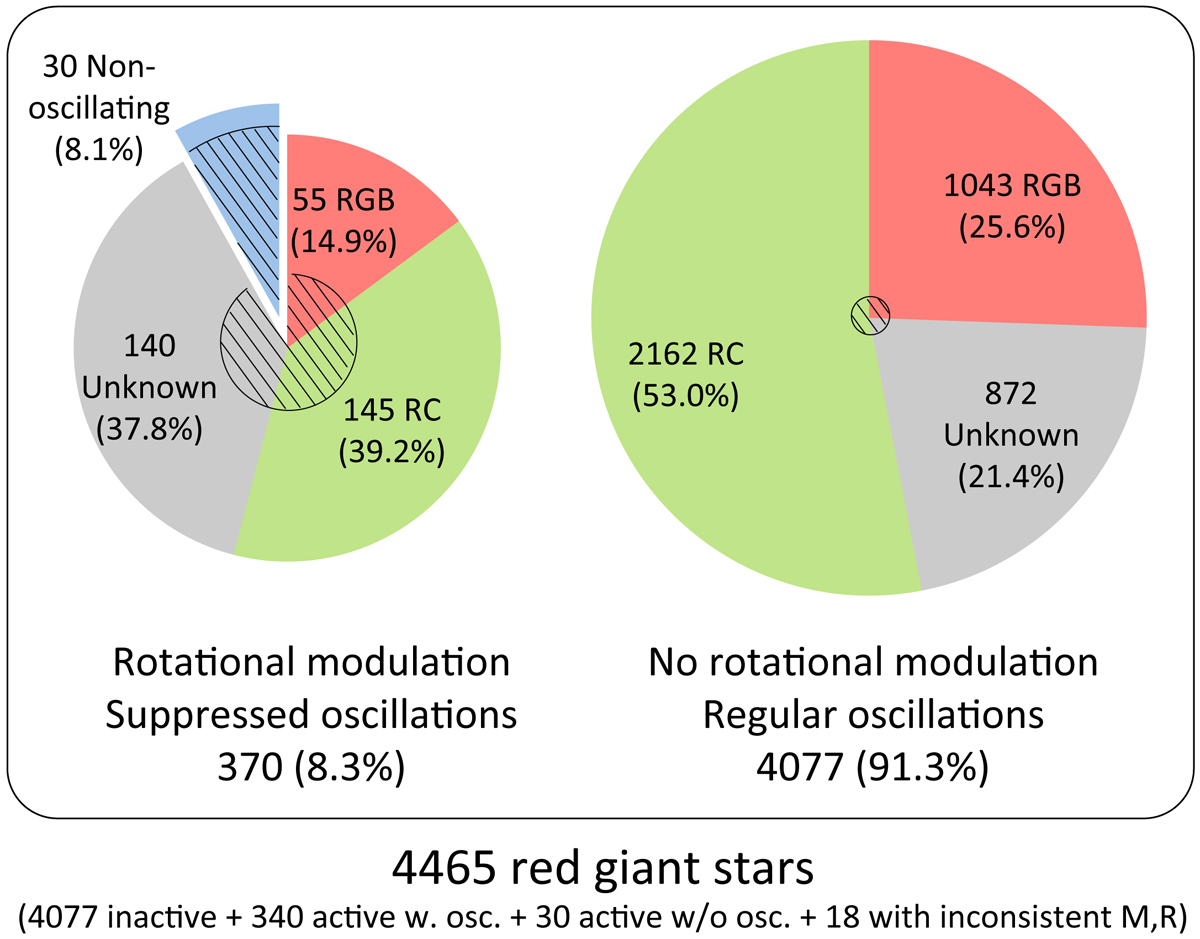
Diagram that summarizes the sample we analyze in this paper. The hatched areas indicate the fraction of spectroscopic binaries among a given population. They represent about 85% of the nonoscillating active RGs, 15% of the active RGs with partially suppressed oscillations, and 2% of the inactive RGs according to our spectroscopic sample. We note that the percentages in the active sample slightly differ from those reported in Table A.1 because they refer to the 370 active stars (with and without detected oscillations) in the present diagram, whereas they refer to the 340 RGs with oscillations in Table A.1.
Current usage metrics show cumulative count of Article Views (full-text article views including HTML views, PDF and ePub downloads, according to the available data) and Abstracts Views on Vision4Press platform.
Data correspond to usage on the plateform after 2015. The current usage metrics is available 48-96 hours after online publication and is updated daily on week days.
Initial download of the metrics may take a while.