Fig. 12.
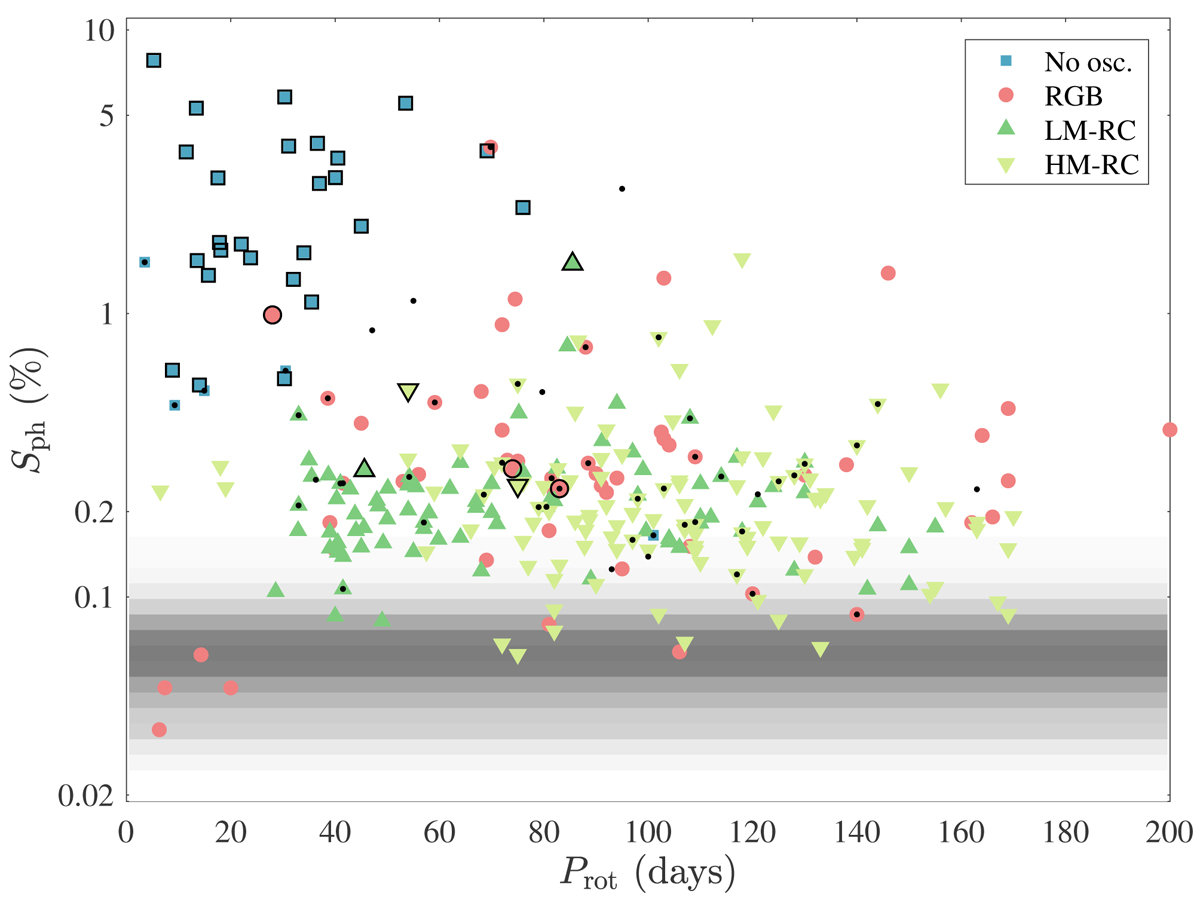
Photometric index Sph (percent) as a function of rotation period Prot (days) for the RGs with rotational modulation. The photometric index Sph is plotted in log scale, Prot in linear scale. Blue squares indicate the nonoscillating RGs, red disks the RGBs, darker green upward-pointing triangles the low-mass RCs, and lighter downward-pointing triangles high-mass RCs. The markers that display black edges are confirmed spectroscopic binaries. Black dots indicate RV stable RGs. The gray background reflects the distribution of Sph of the inactive stars (the darker, the higher).
Current usage metrics show cumulative count of Article Views (full-text article views including HTML views, PDF and ePub downloads, according to the available data) and Abstracts Views on Vision4Press platform.
Data correspond to usage on the plateform after 2015. The current usage metrics is available 48-96 hours after online publication and is updated daily on week days.
Initial download of the metrics may take a while.