Fig. 10.
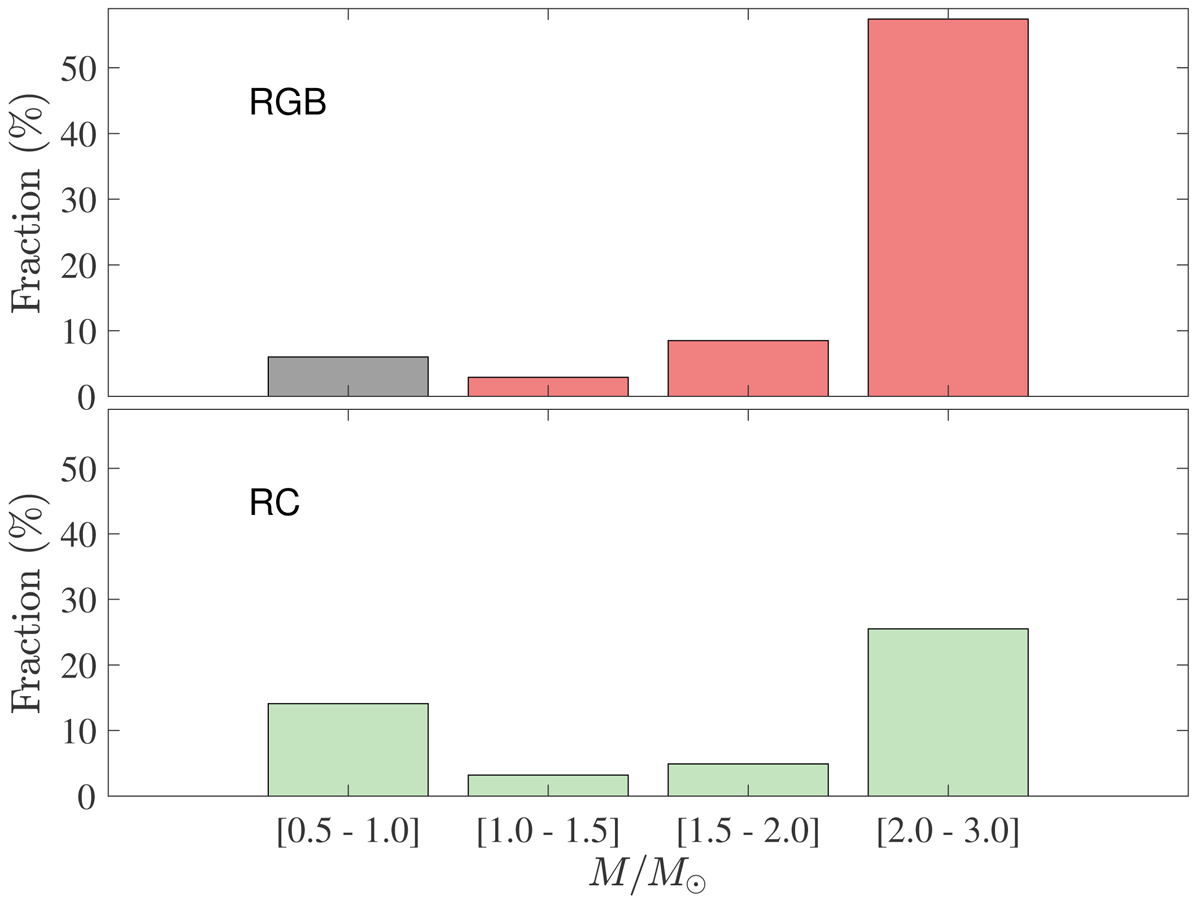
Bar graph showing the fraction of active RGs among the RGB and RC groups as a function of mass. For each mass bin, the estimate of the fraction of active stars is extracted from the number of active stars, the number of inactive stars, and the ratio of stars with a known evolutionary status as explained in Sect. 3.3.2 (Eq. (3)). All the numbers used to produce this graph are displayed in Table A.1. For RGBs with M ∈ [0.5, 1.0] R⊙, the bar is gray because it relies on a very small sample (1 active and 27 inactive RGBs, see Table A.1), and is not statistically secure.
Current usage metrics show cumulative count of Article Views (full-text article views including HTML views, PDF and ePub downloads, according to the available data) and Abstracts Views on Vision4Press platform.
Data correspond to usage on the plateform after 2015. The current usage metrics is available 48-96 hours after online publication and is updated daily on week days.
Initial download of the metrics may take a while.