Fig. 1.
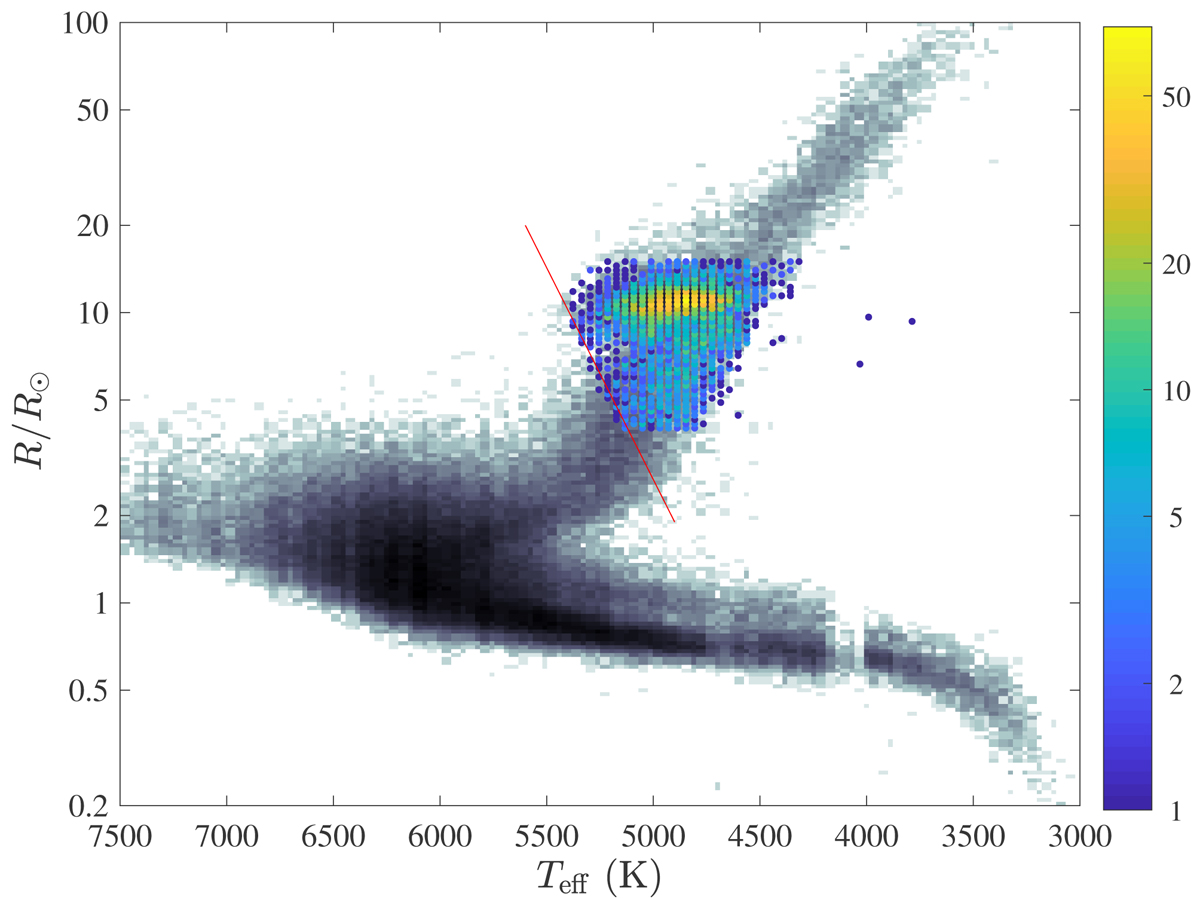
Radius-temperature diagram of the stars available in Berger et al. (2018) in the range [0.2, 100] R⊙ and [3000, 7500] K. Radii are from Gaia and temperatures from the Kepler MAST archive. Temperature axis is reverse, that is with higher Teff toward left. Color-coding represents logarithmic number density. The colored part of the diagram indicates the location of our sample. The red line indicates the limit between subgiant and giant stars according to Berger et al. (2018), such as the RGs lay at the top-right corner. According to Berger et al. (2018), the discontinuity in Teff near 4000 K is an artifact due to systematic shifts in Teff scales in the DR25 Kepler Stellar Properties Catalog.
Current usage metrics show cumulative count of Article Views (full-text article views including HTML views, PDF and ePub downloads, according to the available data) and Abstracts Views on Vision4Press platform.
Data correspond to usage on the plateform after 2015. The current usage metrics is available 48-96 hours after online publication and is updated daily on week days.
Initial download of the metrics may take a while.