Fig. 6
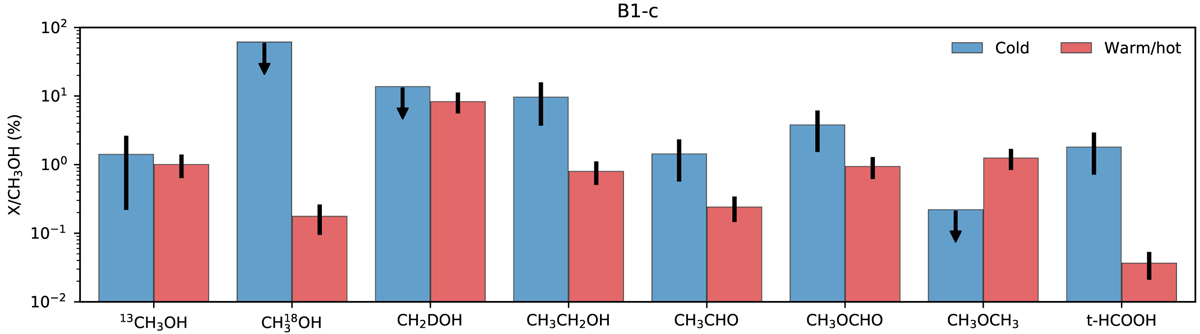
Abundance of several species with respect to CH3OH for our multi-component analysis. The warm (Tex ~ 200 K) component is fixed to the Band 6 model with a 0.45″ source size, whereas the cold (Tex = 60 K) component is fitted with a more extended 2.0″ source size. The 2σ (95%) errors are shown in black, with arrows denoting upper limits. The CH3 OH column density is determined by scaling from 13CH3OH using 12C∕13C = 70 and 16O∕18O = 560, respectively.The higher abundances in the cold component are likely due to an underestimate of the column density of 13CH3OH.
Current usage metrics show cumulative count of Article Views (full-text article views including HTML views, PDF and ePub downloads, according to the available data) and Abstracts Views on Vision4Press platform.
Data correspond to usage on the plateform after 2015. The current usage metrics is available 48-96 hours after online publication and is updated daily on week days.
Initial download of the metrics may take a while.