Fig. 4
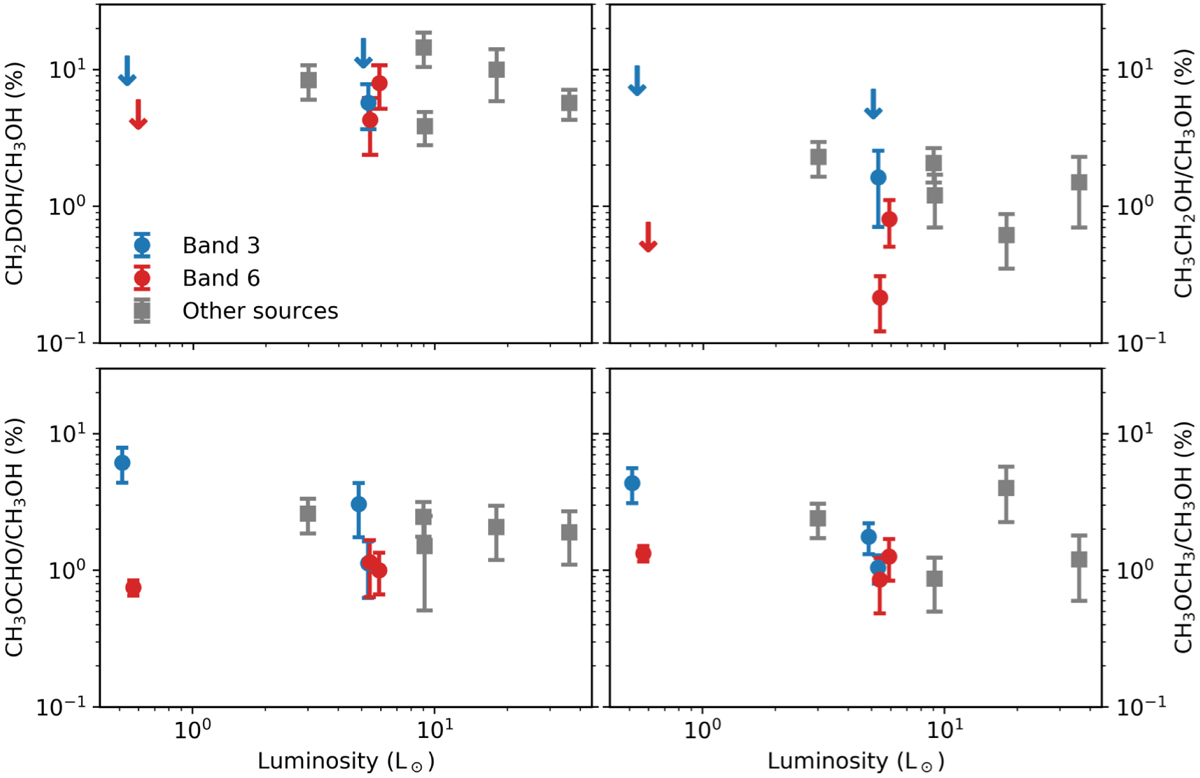
Abundance of CH2DOH (top left), CH3CH2OH (top right), CH3OCHO (bottom left), and CH3OCH3 (bottom right) with respect to CH3OH as a function of bolometric source luminosity. Both the abundances in Band 3 (blue) and Band 6 (red) are plotted; the Band 3 data points are slightly shifted in luminosity for clarity. Arrows denote upper limits. In gray, the abundances of IRAS 2A and IRAS 4A (Taquet et al. 2015, 2019), HH 212 (Lee et al. 2019a), IRAS 16293A (Manigand et al. 2020), and IRAS 16293B (Jørgensen et al. 2018) are presented.
Current usage metrics show cumulative count of Article Views (full-text article views including HTML views, PDF and ePub downloads, according to the available data) and Abstracts Views on Vision4Press platform.
Data correspond to usage on the plateform after 2015. The current usage metrics is available 48-96 hours after online publication and is updated daily on week days.
Initial download of the metrics may take a while.