Fig. 3
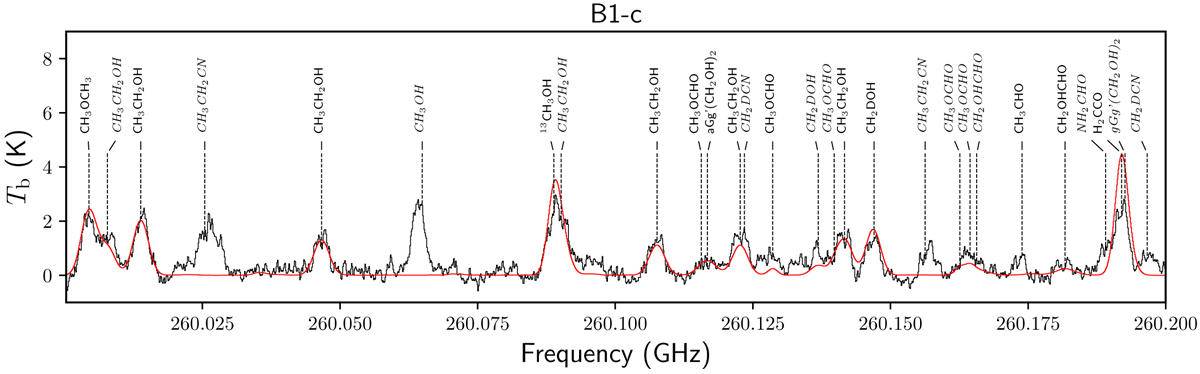
Part of the Band 6 spectrum of B1-c shown in black with the best-fitting model overplotted in red. The window is centered around a few CH3CHO, CH3 OCHO, and CH3CH2OH lines. The focus here is on the O-bearing COMs; for this reason several transitions clearly visible in the data (i.e., CH3 CH2CN) do not showup in the fitting model. Lines in italics were excluded during the fitting.
Current usage metrics show cumulative count of Article Views (full-text article views including HTML views, PDF and ePub downloads, according to the available data) and Abstracts Views on Vision4Press platform.
Data correspond to usage on the plateform after 2015. The current usage metrics is available 48-96 hours after online publication and is updated daily on week days.
Initial download of the metrics may take a while.