Fig. 1
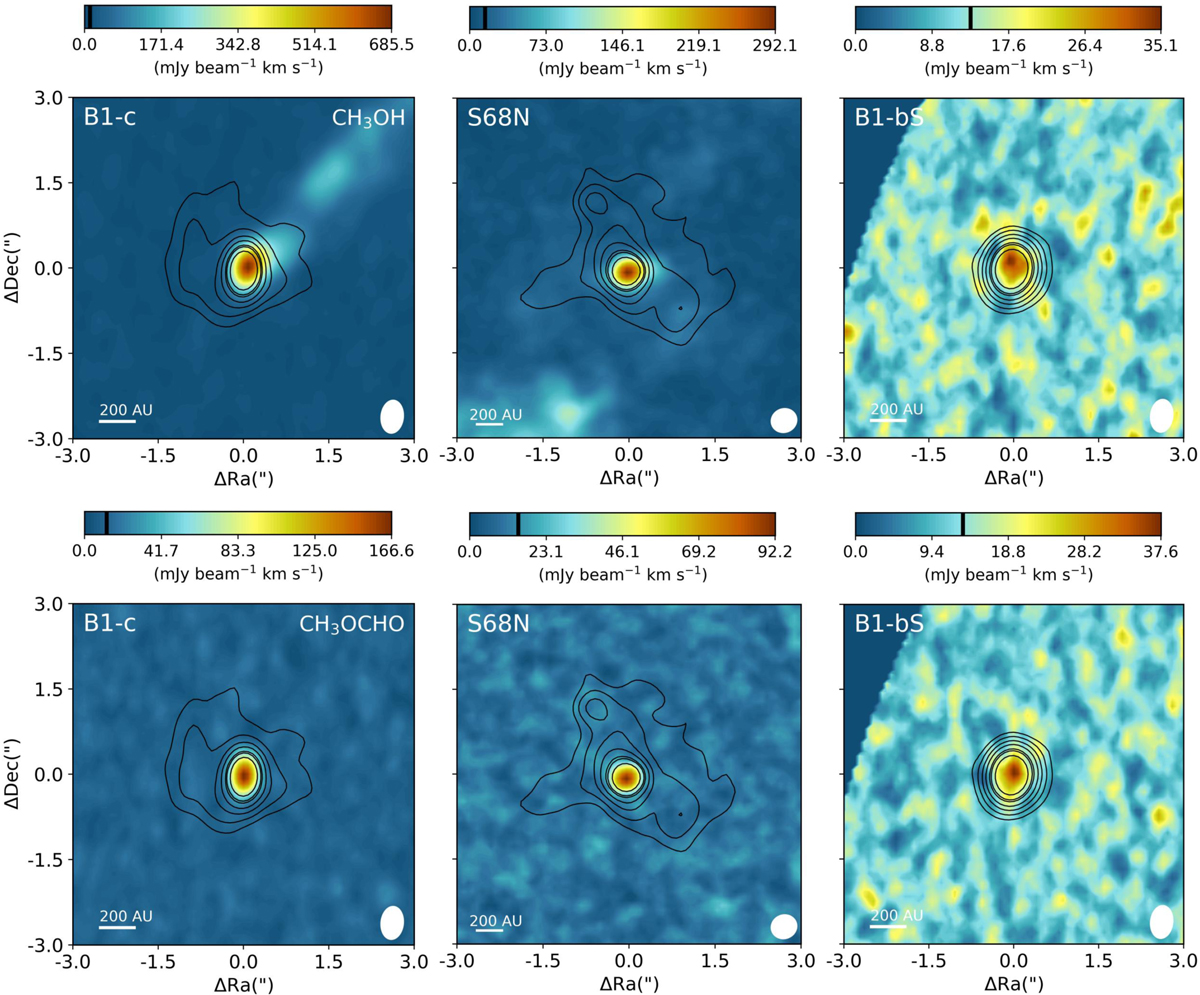
ALMA Band 6 moment-zero images of the COM-rich sources analyzed in this study: B1-c (left), S68N (middle), and B1-bS (right). In color the spatial distribution of CH3 OH 21,1 –10,1 (top row, Eup = 28 K) and CH3 OCHO 217,14 –207,13 emission (bottom row, Eup = 170 K) is shown, with the color scale shown on top of each image. The images are integrated over [− 10,10] km s−1 with respect to the Vlsr. In the color bar, the 3σline level is indicated with the black bar, with σline = 4.0, 4.9, and 4.4 mJy beam−1 km s−1 for B1-c, S68N, and B1-bS, respectively. The continuum is shown with the black contours with increasing [3,5,8,12,18,21,30] σcont, where σcont is 1.5, 0.8, and 1.0 mJy beam−1 km s−1 for B1-c, S68N,and B1-bS, respectively. The size of the beam is shown in the lower right of each image, and in the lower left a scale bar is displayed. The image of B1-bS has a lower S/N since the source is located on the edge of the primary beam.
Current usage metrics show cumulative count of Article Views (full-text article views including HTML views, PDF and ePub downloads, according to the available data) and Abstracts Views on Vision4Press platform.
Data correspond to usage on the plateform after 2015. The current usage metrics is available 48-96 hours after online publication and is updated daily on week days.
Initial download of the metrics may take a while.