Free Access
Fig. 6
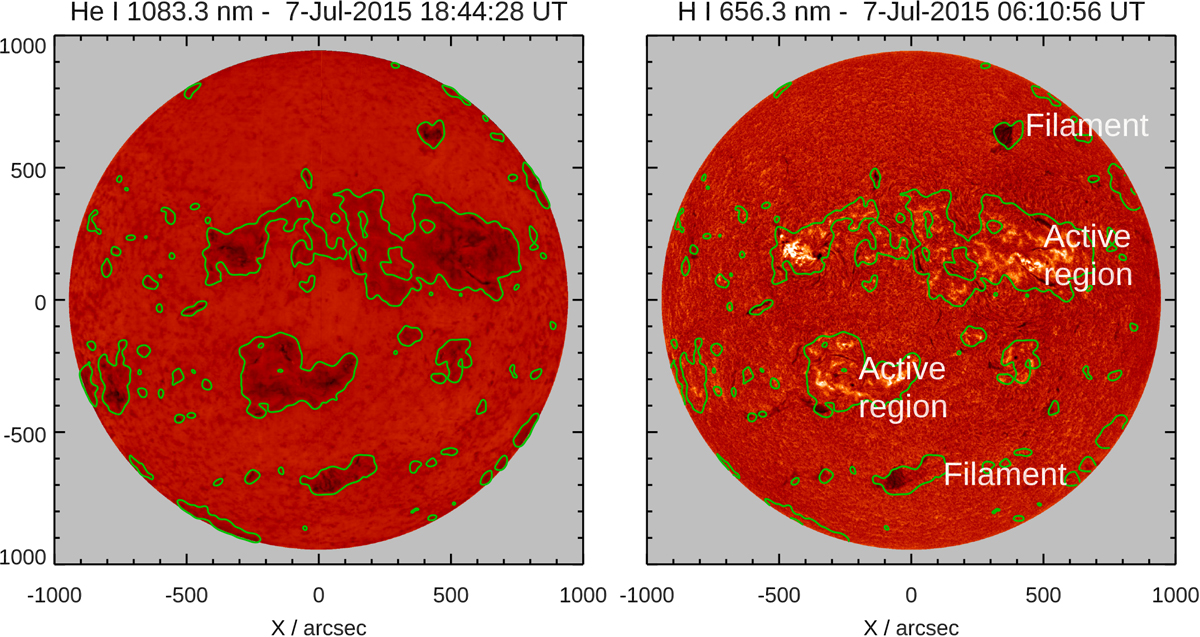
Solar maps corrected for average limb variation of He I 1083.3 nm (left) and Hα (right). Smoothed green contours delineate areas with enhanced emission or absorption with respect to the average line centre intensity.
Current usage metrics show cumulative count of Article Views (full-text article views including HTML views, PDF and ePub downloads, according to the available data) and Abstracts Views on Vision4Press platform.
Data correspond to usage on the plateform after 2015. The current usage metrics is available 48-96 hours after online publication and is updated daily on week days.
Initial download of the metrics may take a while.