Fig. 3
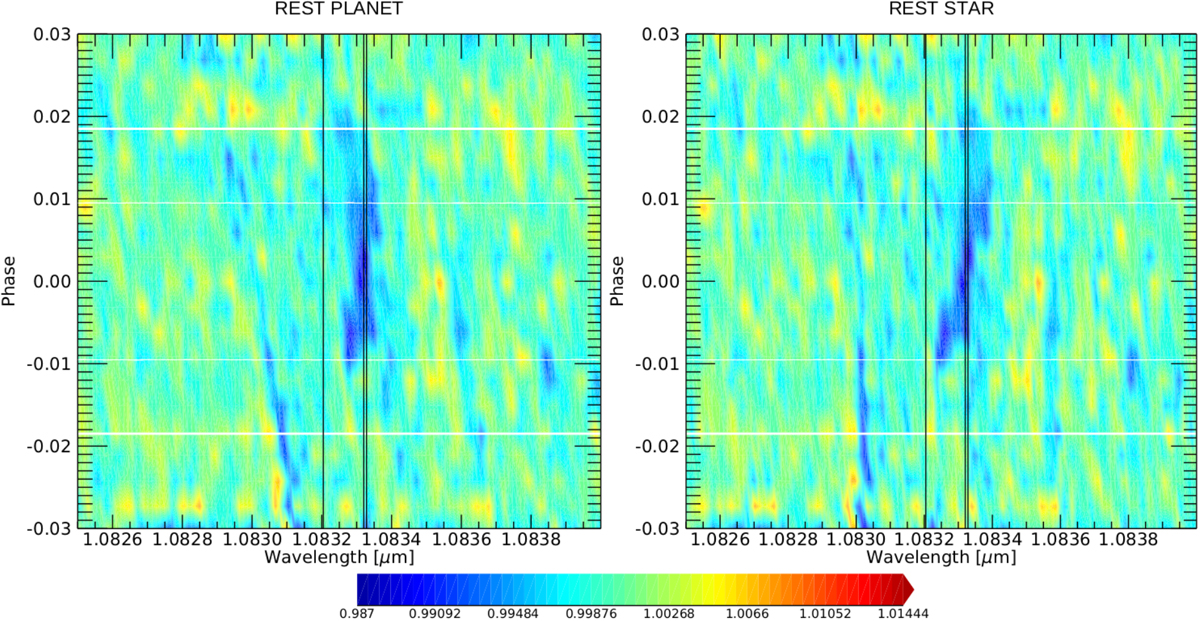
Transmission spectra shown in tomography in the planetary (left) and stellar (right) rest frame, as a function of the wavelength and the orbital phase (transmission spectra are binned both in wavelength and in phase). An excess absorption (in blue) is present during the transit, the three helium triplet lines are indicated with vertical black lines. The contact point t1, t2, t3 and t4 are marked with horizontal white lines.
Current usage metrics show cumulative count of Article Views (full-text article views including HTML views, PDF and ePub downloads, according to the available data) and Abstracts Views on Vision4Press platform.
Data correspond to usage on the plateform after 2015. The current usage metrics is available 48-96 hours after online publication and is updated daily on week days.
Initial download of the metrics may take a while.