Fig. A.1
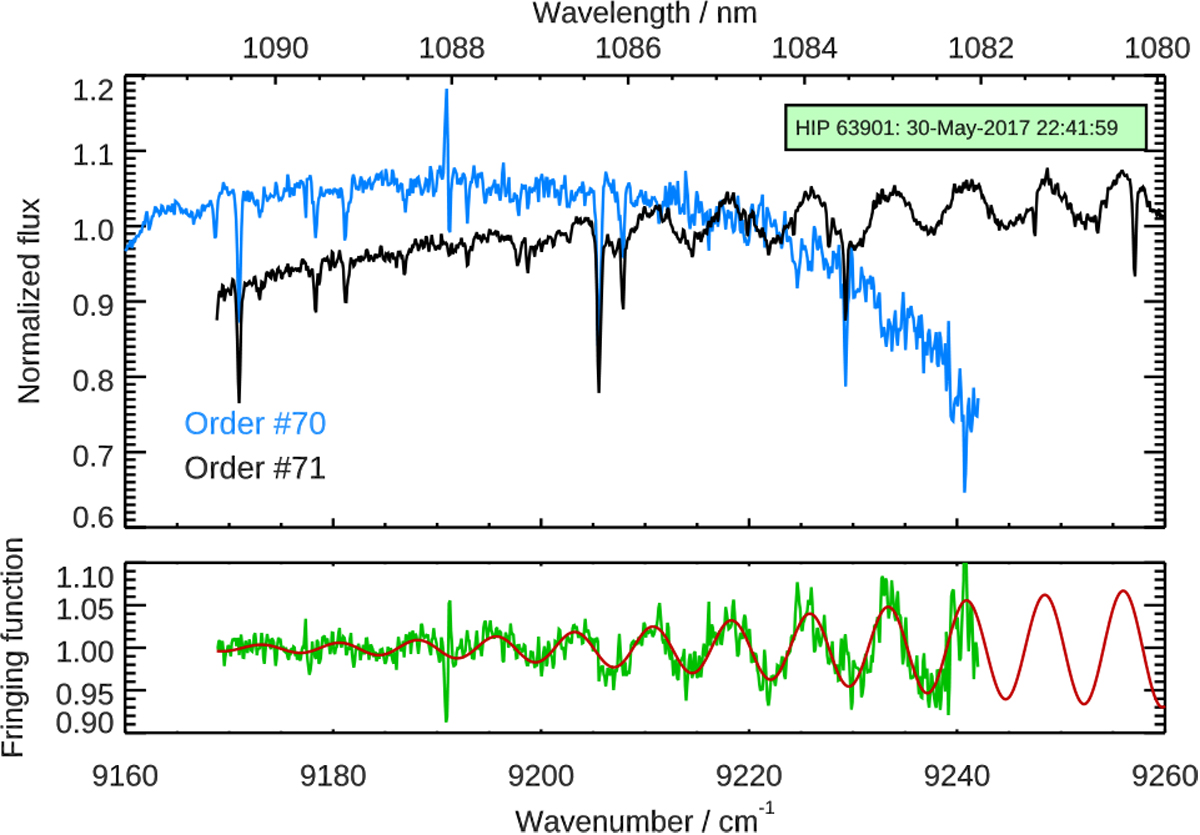
Fringing correction for transit 3 (upper panels) and transit 1 (lower panels). The mean in-transit transmission spectra in the stellar rest frame for the A-nodding position before the fringing correction, with overplotted Ffrin (in red), areshown in the left panels, while the right panels show the fringing corrected mean spectra. The telluric line residuals are masked (in grey).
Current usage metrics show cumulative count of Article Views (full-text article views including HTML views, PDF and ePub downloads, according to the available data) and Abstracts Views on Vision4Press platform.
Data correspond to usage on the plateform after 2015. The current usage metrics is available 48-96 hours after online publication and is updated daily on week days.
Initial download of the metrics may take a while.