Free Access
Fig. 1
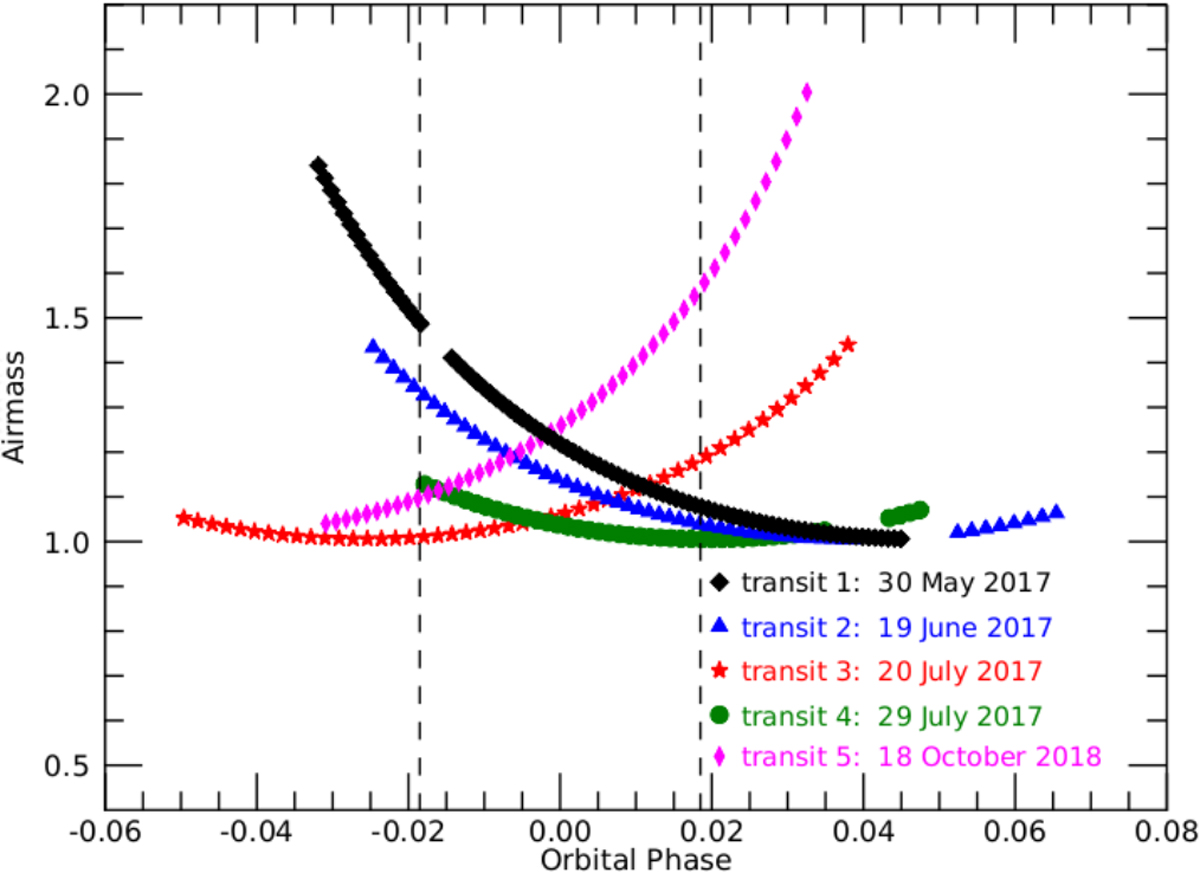
Airmass during the GIARPS observations. The colour and symbol coding presented here will be adopted consistently throughout the work. The contact points t1 and t4 are marked with vertical dashed lines.
Current usage metrics show cumulative count of Article Views (full-text article views including HTML views, PDF and ePub downloads, according to the available data) and Abstracts Views on Vision4Press platform.
Data correspond to usage on the plateform after 2015. The current usage metrics is available 48-96 hours after online publication and is updated daily on week days.
Initial download of the metrics may take a while.