Fig. 7
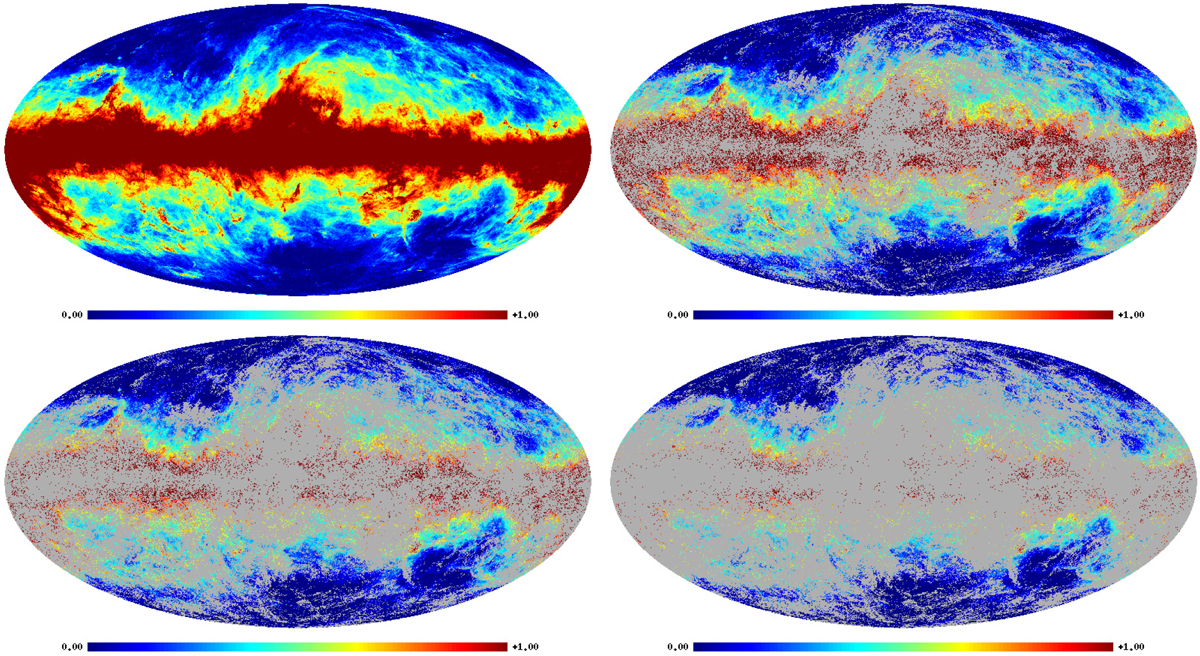
Far-IR emission at 857 GHz as observed by Planck, original data at top left. To indicate upper limits for Tkin, positionswith CNM Doppler temperatures below thresholds of 155, 220, and 311 K (topright, bottom left, and bottom right) are masked. The color scale represents log(I857/MJy sr−1).
Current usage metrics show cumulative count of Article Views (full-text article views including HTML views, PDF and ePub downloads, according to the available data) and Abstracts Views on Vision4Press platform.
Data correspond to usage on the plateform after 2015. The current usage metrics is available 48-96 hours after online publication and is updated daily on week days.
Initial download of the metrics may take a while.