Fig. 2
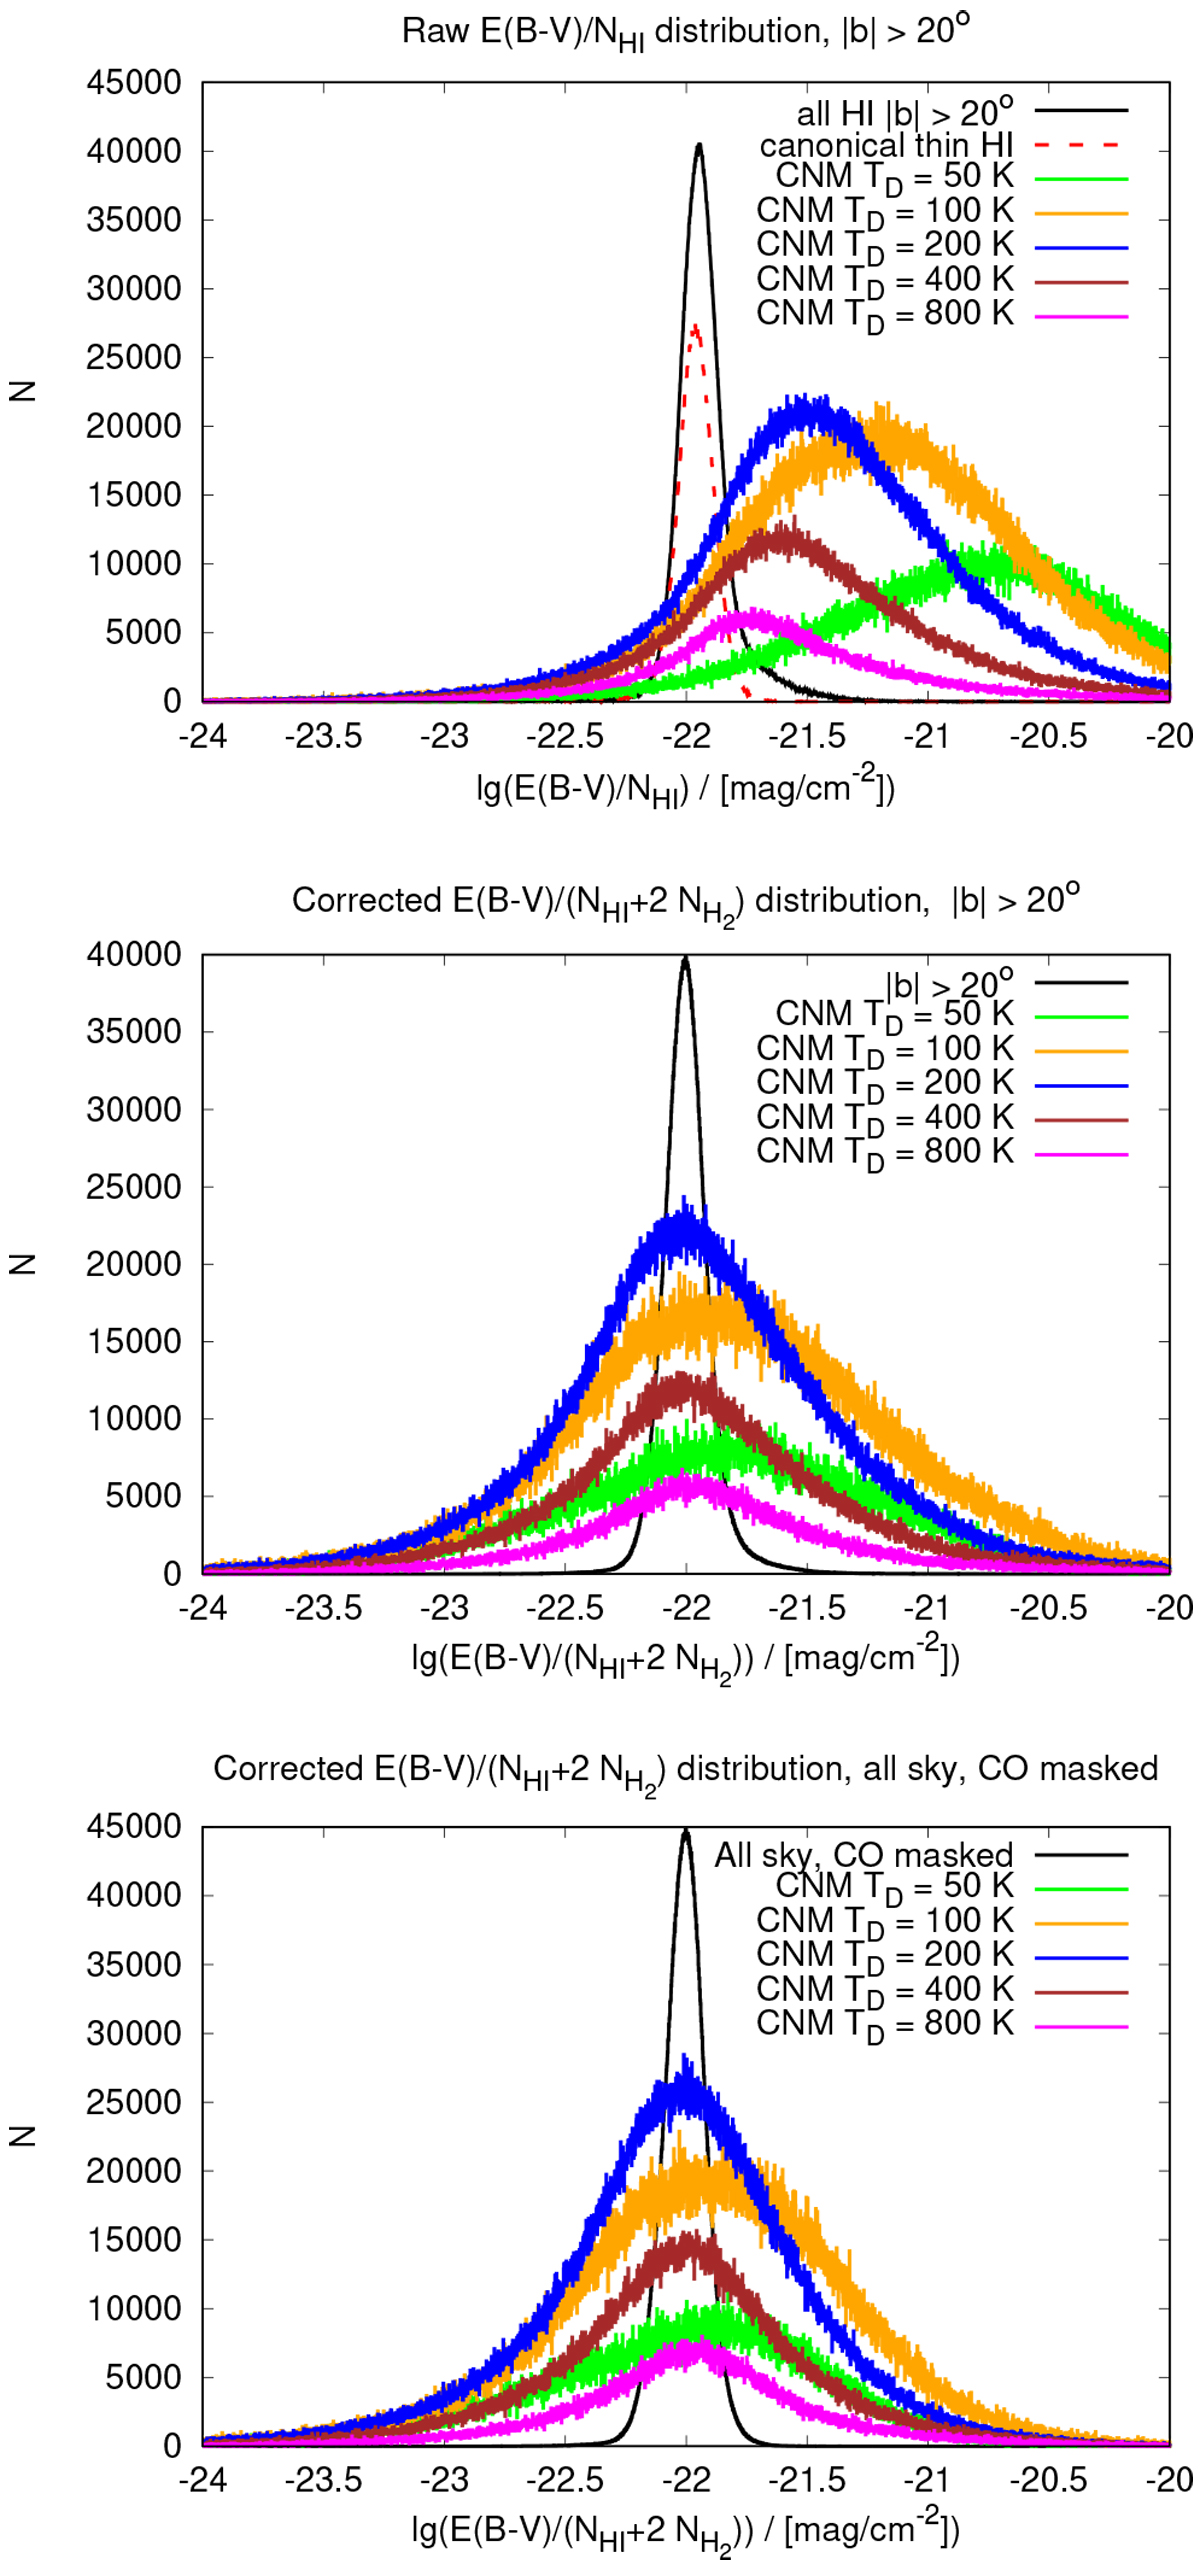
Probability distribution functions for Gaussian components with selected Doppler temperatures
![]() ,
top: E(B−V)∕NHI
for latitudes |b| > 20°
(black) and for canonical thin H I (red dashed line) (Lenz et al. 2017) compared to distributions of partial
E(B− V)∕NHI
ratios at Doppler temperatures TD = 50, 100, 200, 400, and 800 K. Middle: E(B−V)∕(NHI + 2NH2) distributionsfor |b| > 20°. All components (black line) in comparison to scaled distribution at selected Doppler temperatures. Bottom:
E(B− V)∕(NHI + 2NH2) distributions now all-sky, but excluding CO–bright regions. The amplitudes of the partial distributions are scaled up by constant factors.
,
top: E(B−V)∕NHI
for latitudes |b| > 20°
(black) and for canonical thin H I (red dashed line) (Lenz et al. 2017) compared to distributions of partial
E(B− V)∕NHI
ratios at Doppler temperatures TD = 50, 100, 200, 400, and 800 K. Middle: E(B−V)∕(NHI + 2NH2) distributionsfor |b| > 20°. All components (black line) in comparison to scaled distribution at selected Doppler temperatures. Bottom:
E(B− V)∕(NHI + 2NH2) distributions now all-sky, but excluding CO–bright regions. The amplitudes of the partial distributions are scaled up by constant factors.
Current usage metrics show cumulative count of Article Views (full-text article views including HTML views, PDF and ePub downloads, according to the available data) and Abstracts Views on Vision4Press platform.
Data correspond to usage on the plateform after 2015. The current usage metrics is available 48-96 hours after online publication and is updated daily on week days.
Initial download of the metrics may take a while.