Fig. 3.
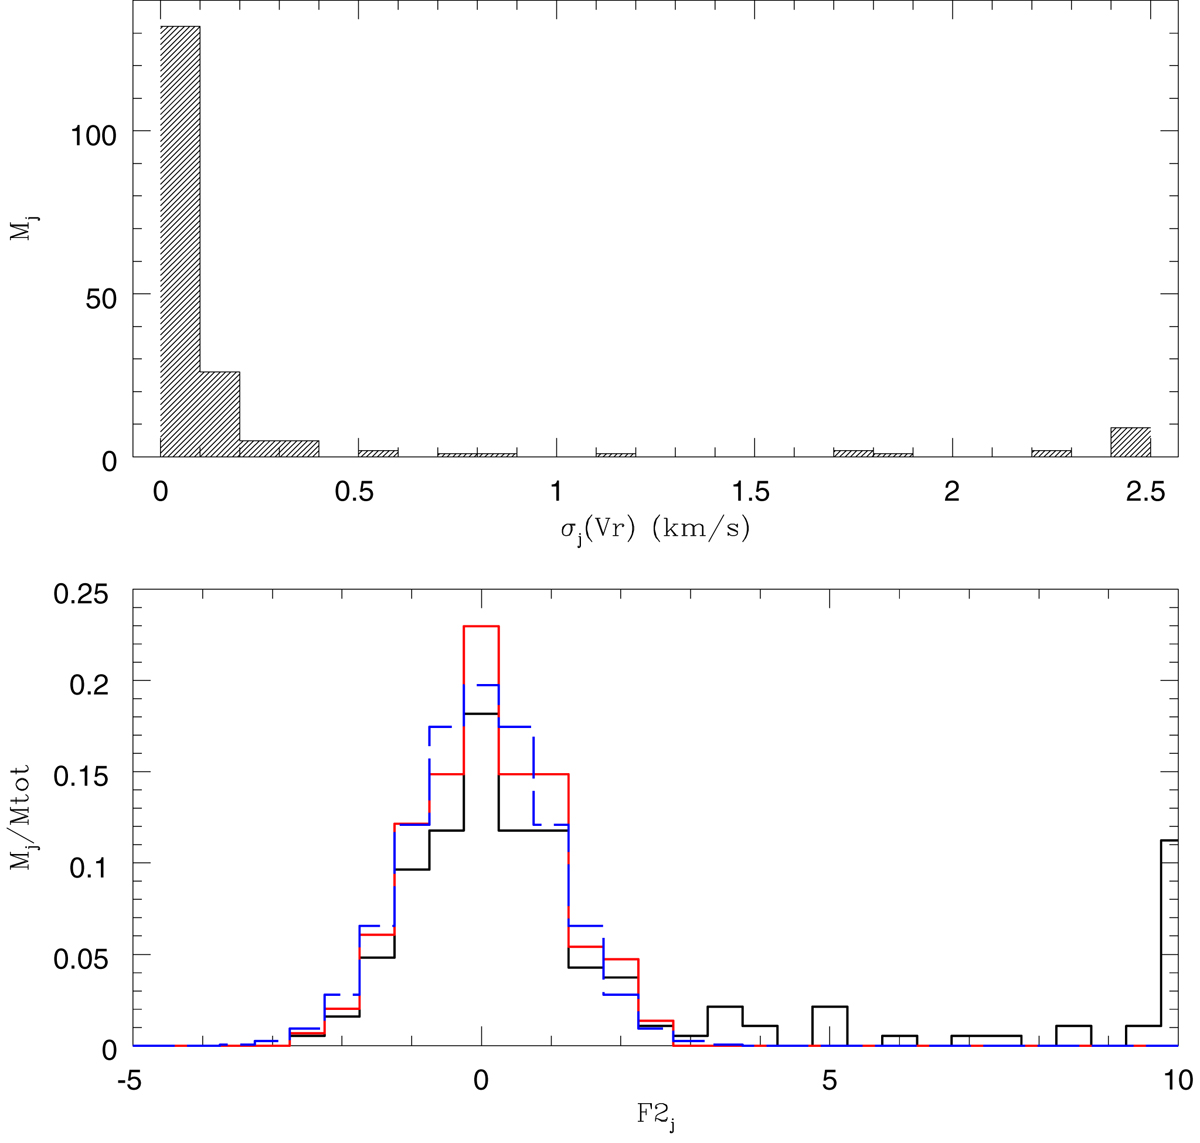
Top panel: distribution of HERMES σj(RV) per star j of the reference sample (R) of CoRoT/Kepler K giants. Bottom: F2j distribution for the same sample. In black is drawn the full sample, and in red the sample with binaries removed (F2 ≥ 3.0), which leads to an almost perfect match between the binary-free observed F2 distribution (red curve) and the expected 𝒩(0, 1) normal-reduced distribution (blue curve).
Current usage metrics show cumulative count of Article Views (full-text article views including HTML views, PDF and ePub downloads, according to the available data) and Abstracts Views on Vision4Press platform.
Data correspond to usage on the plateform after 2015. The current usage metrics is available 48-96 hours after online publication and is updated daily on week days.
Initial download of the metrics may take a while.