Fig. C.7.
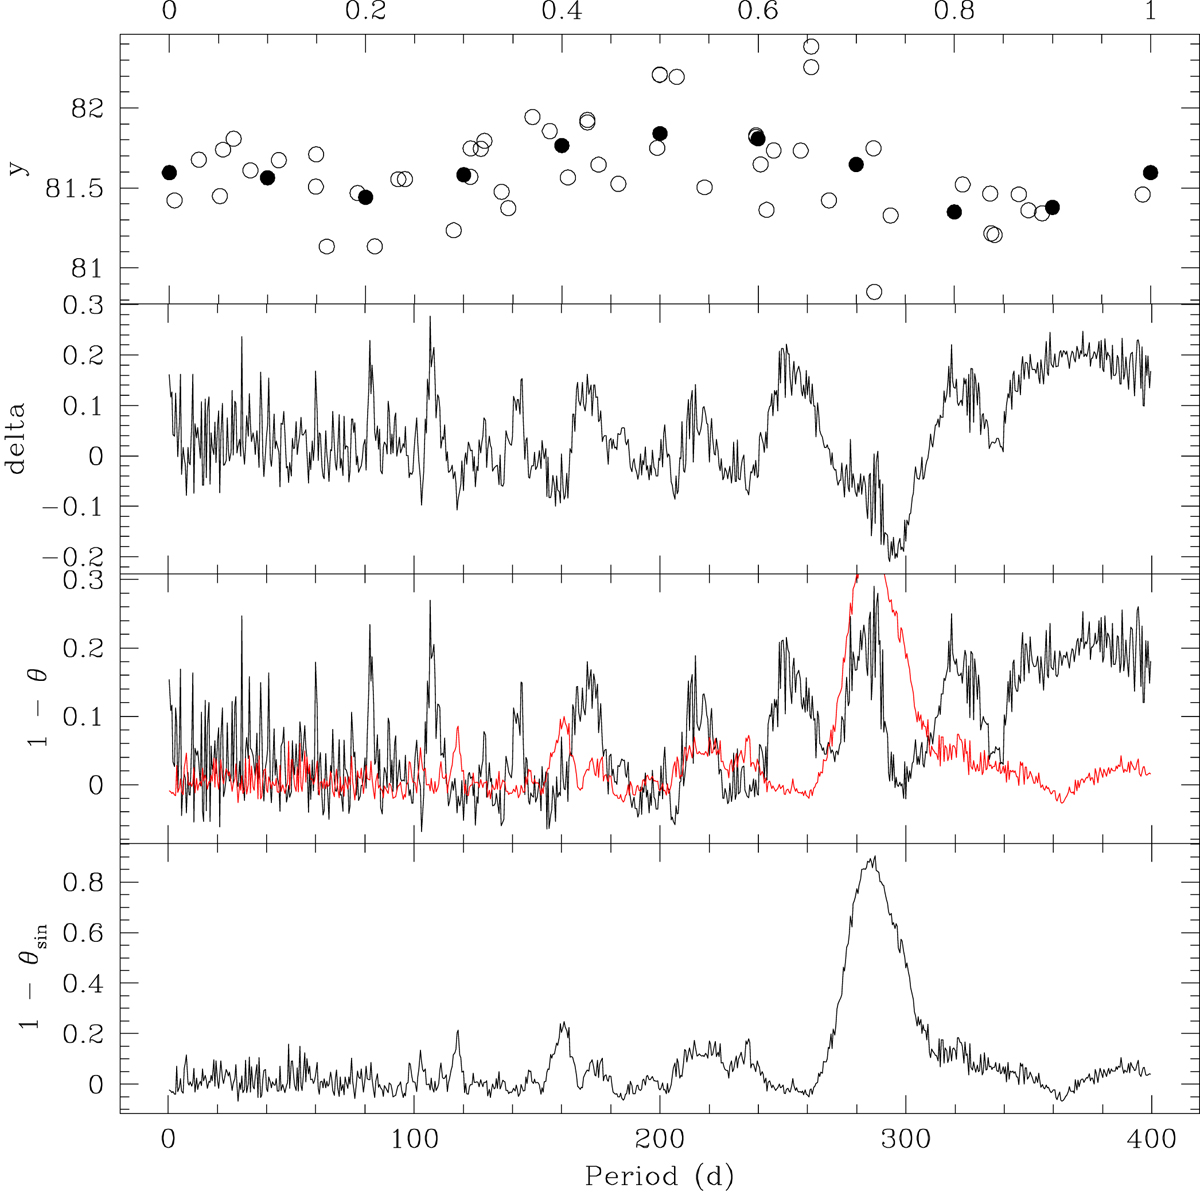
Period analysis of the RVs using the Stellingwerf statistics. Top panel: RVs plotted in phase with a period of 282 d. Bottom panel: Stellingwerf 1 − θ statistical indicator for a sine signal of period 282 d sampled the same way as HD 39853. Middle bottom panel: same as bottom for the 282 d sine signal (red curve) and for the HD 39853 data (black curve). Middle top panel: the difference between the red and black curve of the previous panel, showing possible residual signals (here one around 110 d).
Current usage metrics show cumulative count of Article Views (full-text article views including HTML views, PDF and ePub downloads, according to the available data) and Abstracts Views on Vision4Press platform.
Data correspond to usage on the plateform after 2015. The current usage metrics is available 48-96 hours after online publication and is updated daily on week days.
Initial download of the metrics may take a while.