Fig. 2.
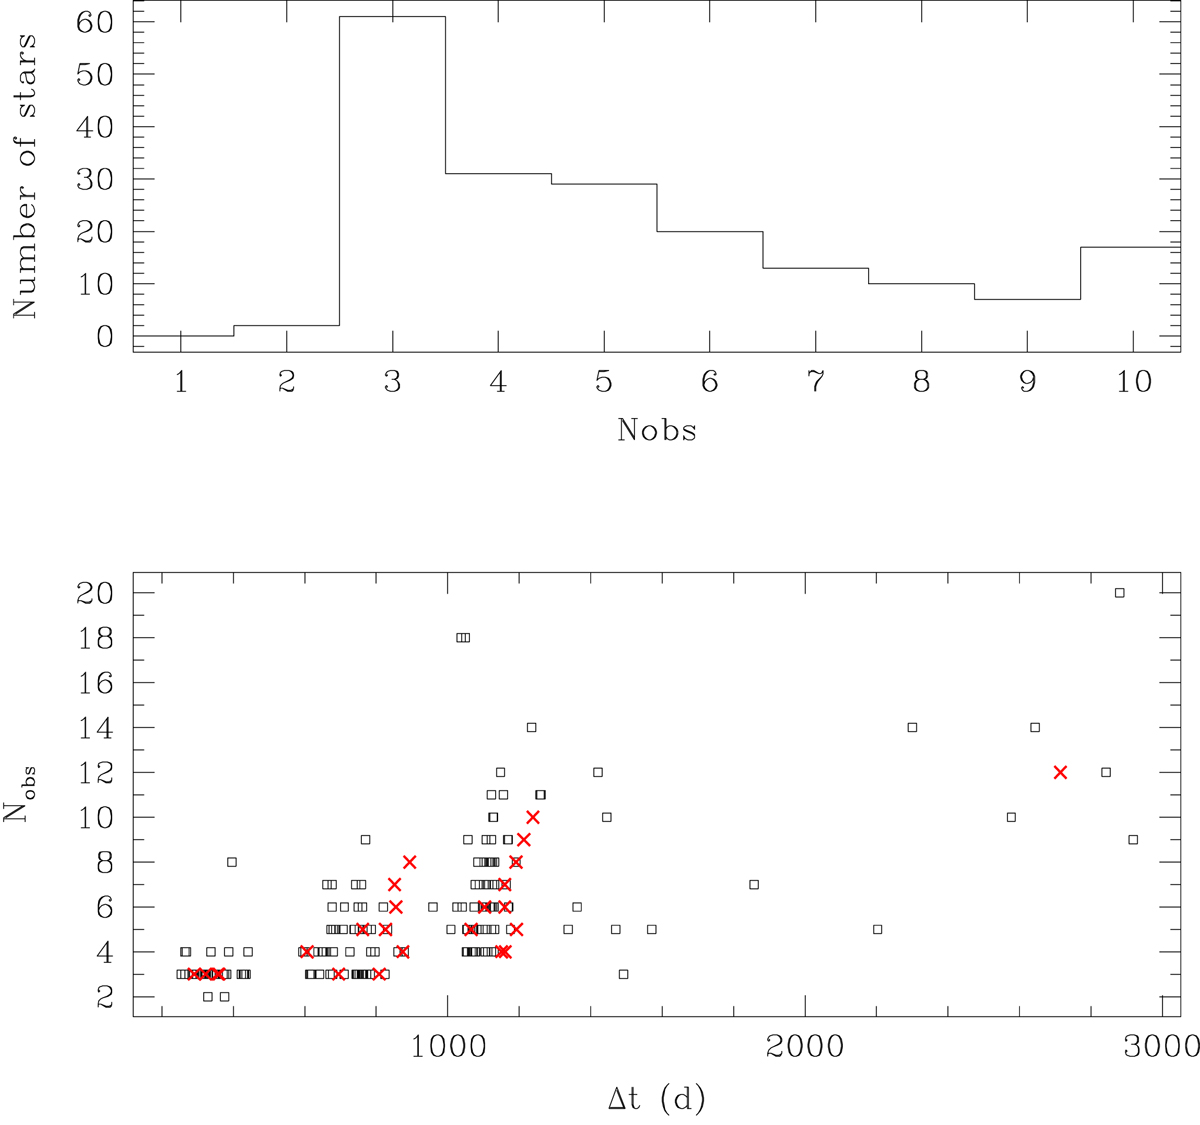
Top panel: distribution of the number of observations per star in sample R. Bottom panel: number of HERMES observations vs. time span of the RV observations for the comparison sample of Kepler/CoRoT giants (sample R; open squares). Most of the stars have three observations spanning 300 to 900 d. Red crosses correspond to the re-sampled data of sample S1 (denoted ‘sample S1’) with Nobs and Δt modified to mimic the distribution of sample R (see Sect. 5.5).
Current usage metrics show cumulative count of Article Views (full-text article views including HTML views, PDF and ePub downloads, according to the available data) and Abstracts Views on Vision4Press platform.
Data correspond to usage on the plateform after 2015. The current usage metrics is available 48-96 hours after online publication and is updated daily on week days.
Initial download of the metrics may take a while.