Fig. 1.
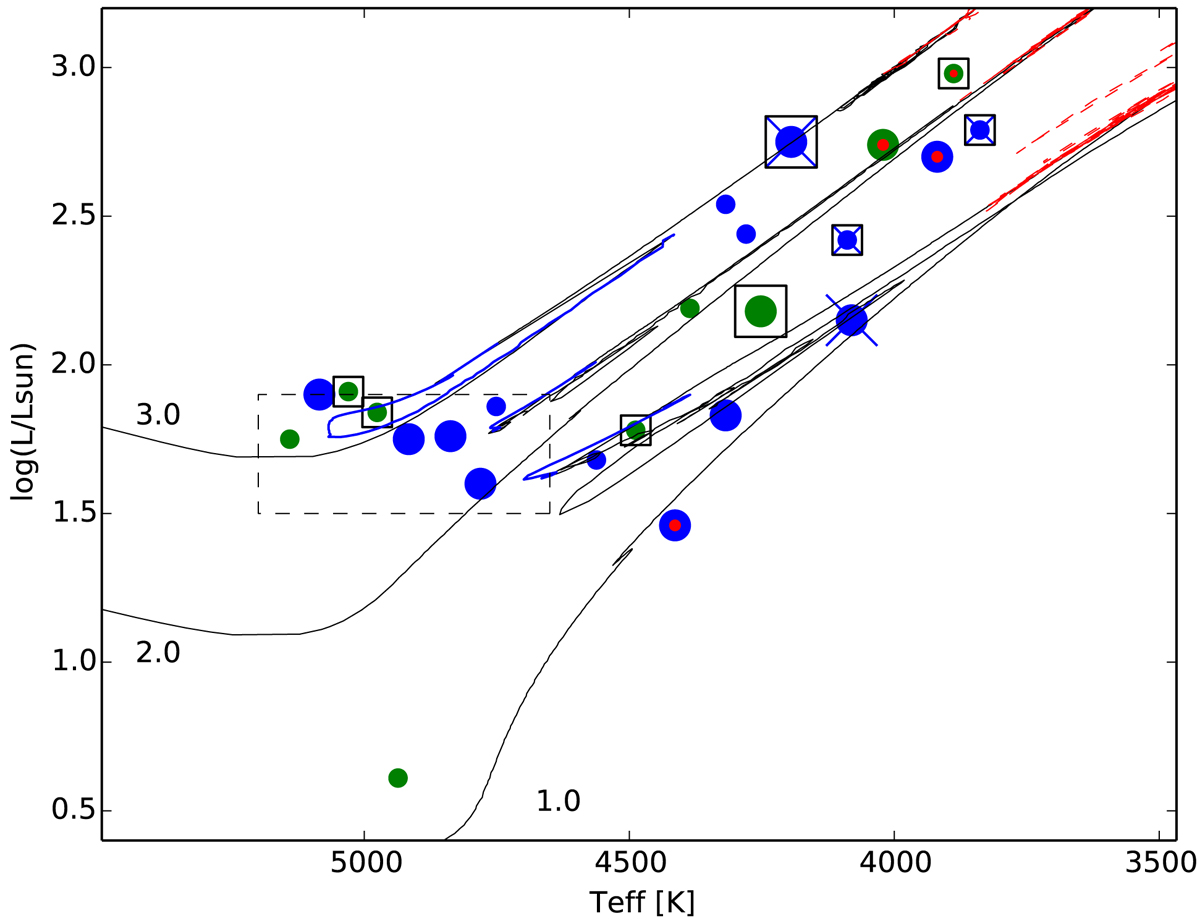
Li-rich (large filled dots) and dust-rich (open squares) K giants from sample S1 in the HR diagram. Small filled dots are non-Li-rich K giants. Green symbols denote SB, as discussed in Sect. 5. Small red dots indicate the presence of regular small-amplitude variations, whereas large crosses indicate irregular small-amplitude variations (RV jitter). STAREVOL tracks (Siess et al. 2000; Siess & Arnould 2008) are labelled according to their initial mass, and correspond to solar metallicity. Tracks evolving along the core He-burning phase are depicted in blue, whereas tracks along the AGB are displayed in red. The red clump as defined by Deepak & Reddy (2019; their Fig. 1) is represented by the dashed rectangle. The bump is well visible on the 1 M⊙ track as the hook feature located to the lower right of the red clump region.
Current usage metrics show cumulative count of Article Views (full-text article views including HTML views, PDF and ePub downloads, according to the available data) and Abstracts Views on Vision4Press platform.
Data correspond to usage on the plateform after 2015. The current usage metrics is available 48-96 hours after online publication and is updated daily on week days.
Initial download of the metrics may take a while.