Fig. 6.
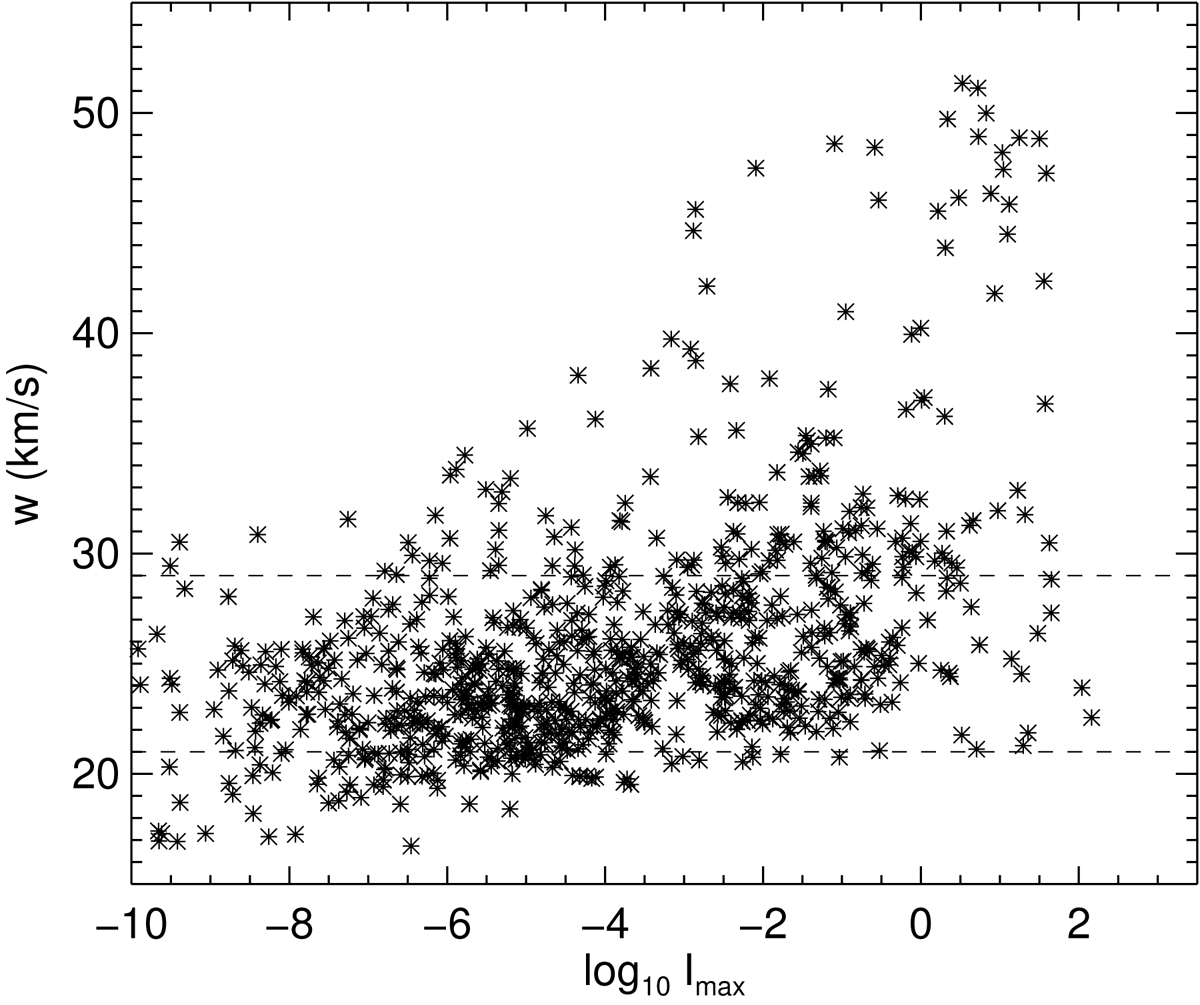
Correlation between intensity and width of Fe XII synthesised from the model. Scatter plot of the peak intensity versus the 1/e-width of a fitted Gaussian, for viewing windows of size 0.5 Mm2 at t = 124 s. The horizontal lines at w = 21 km s−1 and w = 29 km s−1 correspond to non-thermal broadening of 0 and 20 km s−1, respectively, based on a thermal width of 21 km s−1 (T = 1.5 × 10⁶ K). See Sect. 3.4.
Current usage metrics show cumulative count of Article Views (full-text article views including HTML views, PDF and ePub downloads, according to the available data) and Abstracts Views on Vision4Press platform.
Data correspond to usage on the plateform after 2015. The current usage metrics is available 48-96 hours after online publication and is updated daily on week days.
Initial download of the metrics may take a while.