Fig. 5.
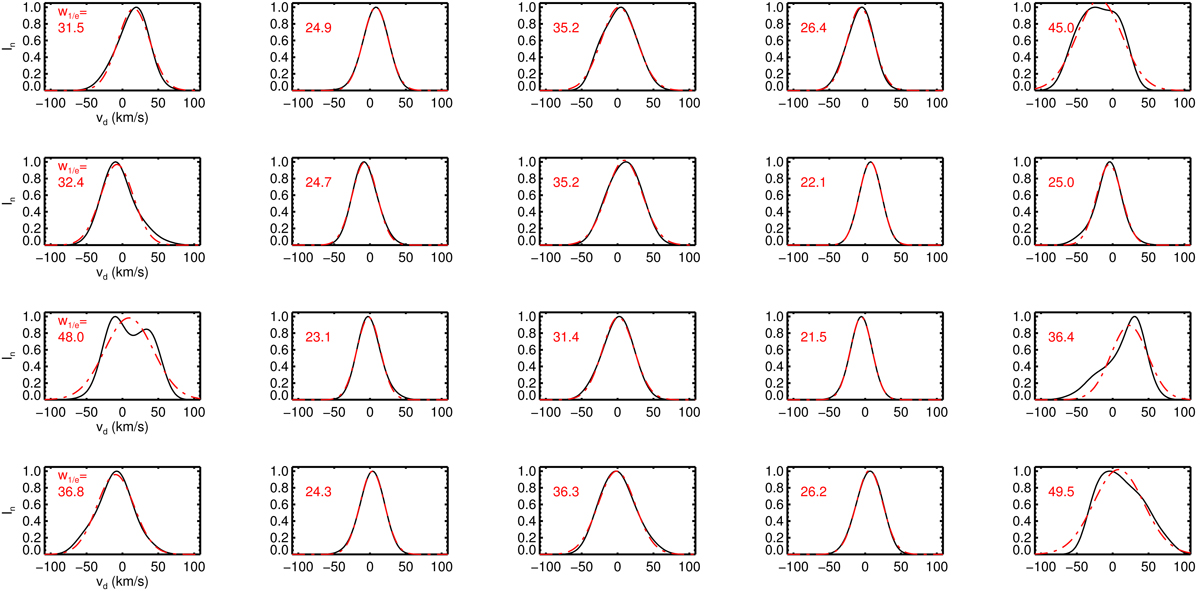
Line profiles of Fe XII for various times and windows of the same size as the smallest one in Fig. 4 (0.5 Mm × 0.5 Mm). Rows are times: t = 40, t = 60, t = 72, t = 92. Columns are position across the loop (all at the same height): centre is in the centre and adjacent to it are windows adjacent on either side. The far-left and far-right plots are for windows located immediately inside the largest viewing window of Figs. 1b and 2.
Current usage metrics show cumulative count of Article Views (full-text article views including HTML views, PDF and ePub downloads, according to the available data) and Abstracts Views on Vision4Press platform.
Data correspond to usage on the plateform after 2015. The current usage metrics is available 48-96 hours after online publication and is updated daily on week days.
Initial download of the metrics may take a while.