Fig. 4.
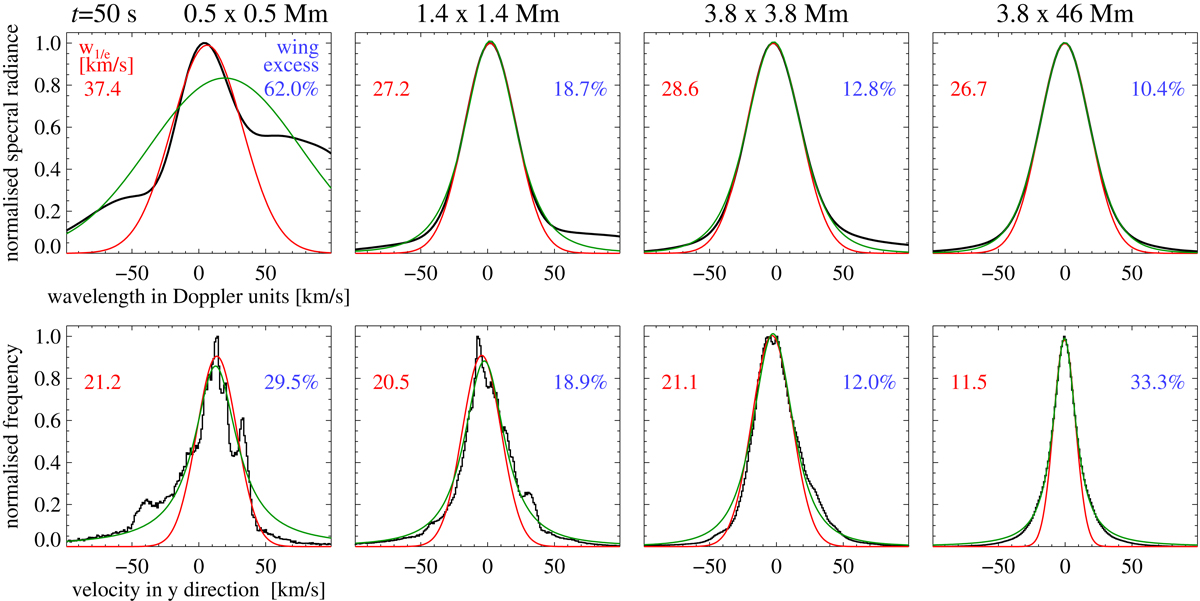
Synthesised line profiles and velocity distributions at time t = 50 s. Top row: profiles of the Fe XII line at 193 Å with the peak intensity normalised to unity plotted as a function of Doppler velocity (black). These are for field-of-views of different sizes as indicated above the panels and illustrated in Fig. 1b. Bottom: histograms of LOS velocities (vy) at voxels within the corresponding viewing window (black). The red lines show single Gaussian fits to the respective profiles. The numbers in red in the top left of each panel indicate the width of each Gaussian fit (Gaussian width equal to half width at 1/e of line peak). The percentages in blue in the top right show the emission of the actual profile (in black) in excess of the single Gaussian fit (in red). The green profiles show a fit to the line profile or velocity distribution by a kappa function.
Current usage metrics show cumulative count of Article Views (full-text article views including HTML views, PDF and ePub downloads, according to the available data) and Abstracts Views on Vision4Press platform.
Data correspond to usage on the plateform after 2015. The current usage metrics is available 48-96 hours after online publication and is updated daily on week days.
Initial download of the metrics may take a while.