Fig. 3.
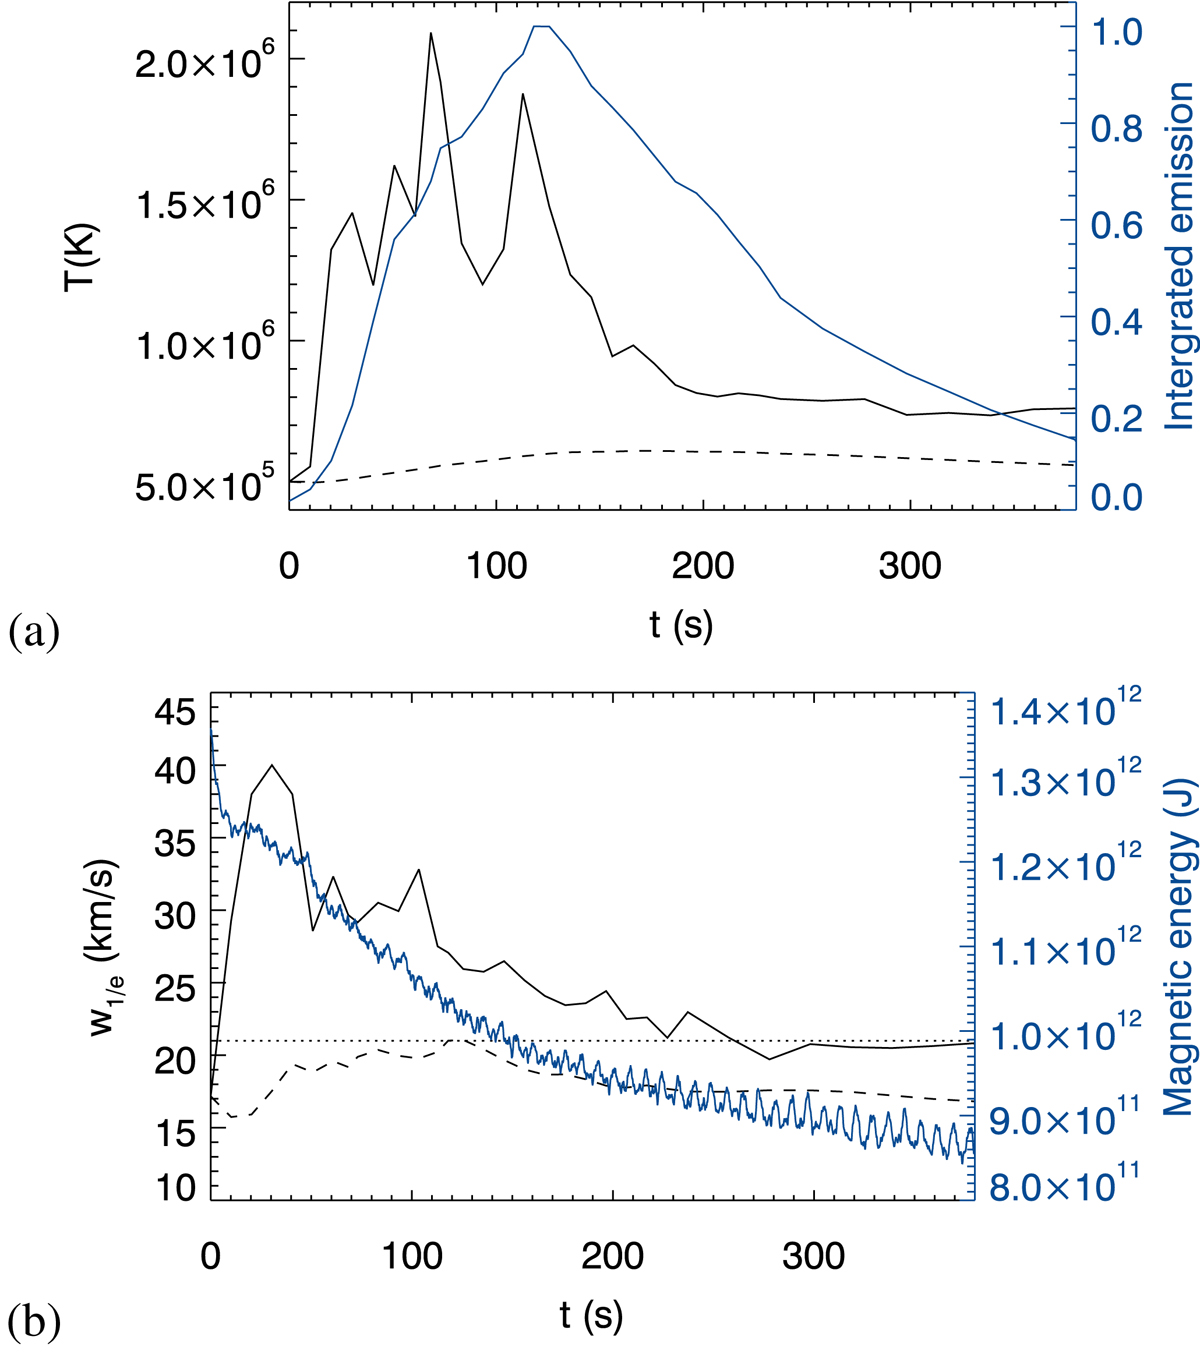
Temporal evolution of the relaxing loop. (a) Peak temperature (solid line) and average temperature (dashed) for x, y ∈ [ − 1.9, 1.9] Mm, z ∈ [ − 23, 23] Mm, together with the emission in Fe XII integrated over the same volume, i.e. essentially from the whole loop. (b) Blue: magnetic energy in excess of the energy of the potential (uniform, vertical) field during the simulation. Black solid line: spectral line width with line of sight parallel to the y-axis and viewing window with limits x ∈ [ − 1.9, 1.9] Mm, z ∈ [ − 23, 23] Mm. Black dashed line: line width with LOS parallel to the loop axis for z ∈ [10, 20] Mm and viewing window x ∈ [ − 2.3, 2.3], y ∈ [ − 2.6, 2.6] Mm. Dotted: thermal width of 21 km s−1 at T = 1.5 × 10⁶ K.
Current usage metrics show cumulative count of Article Views (full-text article views including HTML views, PDF and ePub downloads, according to the available data) and Abstracts Views on Vision4Press platform.
Data correspond to usage on the plateform after 2015. The current usage metrics is available 48-96 hours after online publication and is updated daily on week days.
Initial download of the metrics may take a while.