Free Access
Fig. 2.
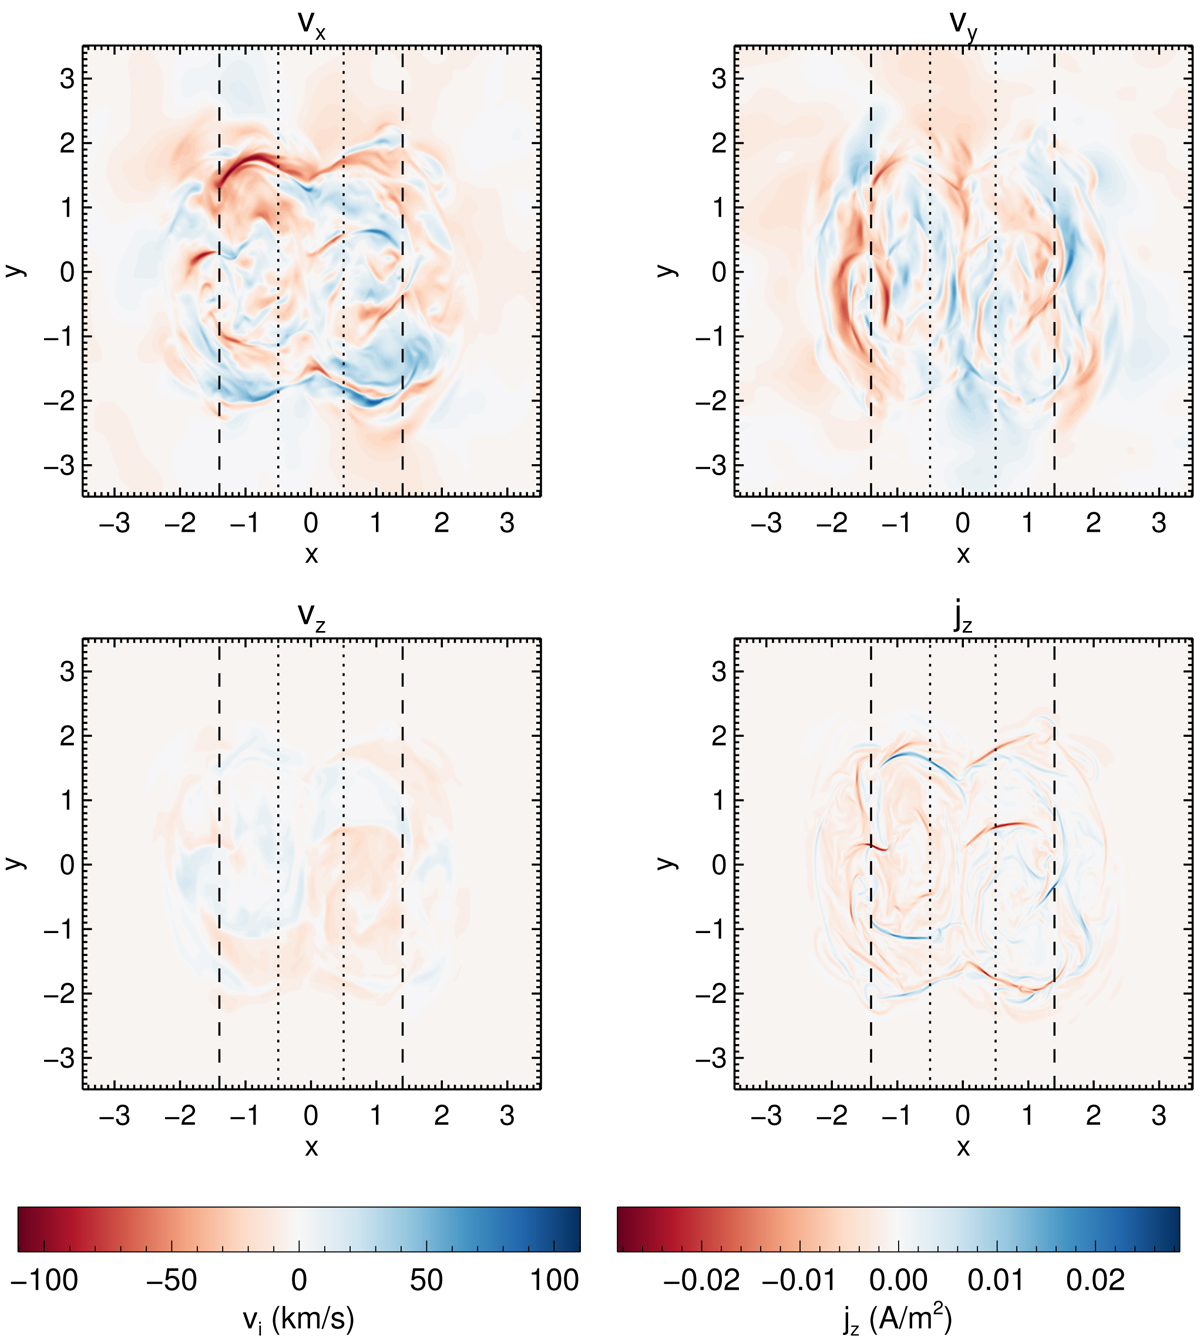
Turbulence induced flows and currents in the loop. All three velocity components and the current density parallel to the loop axis, in the plane z = 2 Mm, after 92 s of the simulation. Over-plotted are boxes showing the fields-of-view used in Fig. 4.
Current usage metrics show cumulative count of Article Views (full-text article views including HTML views, PDF and ePub downloads, according to the available data) and Abstracts Views on Vision4Press platform.
Data correspond to usage on the plateform after 2015. The current usage metrics is available 48-96 hours after online publication and is updated daily on week days.
Initial download of the metrics may take a while.