Fig. 1.
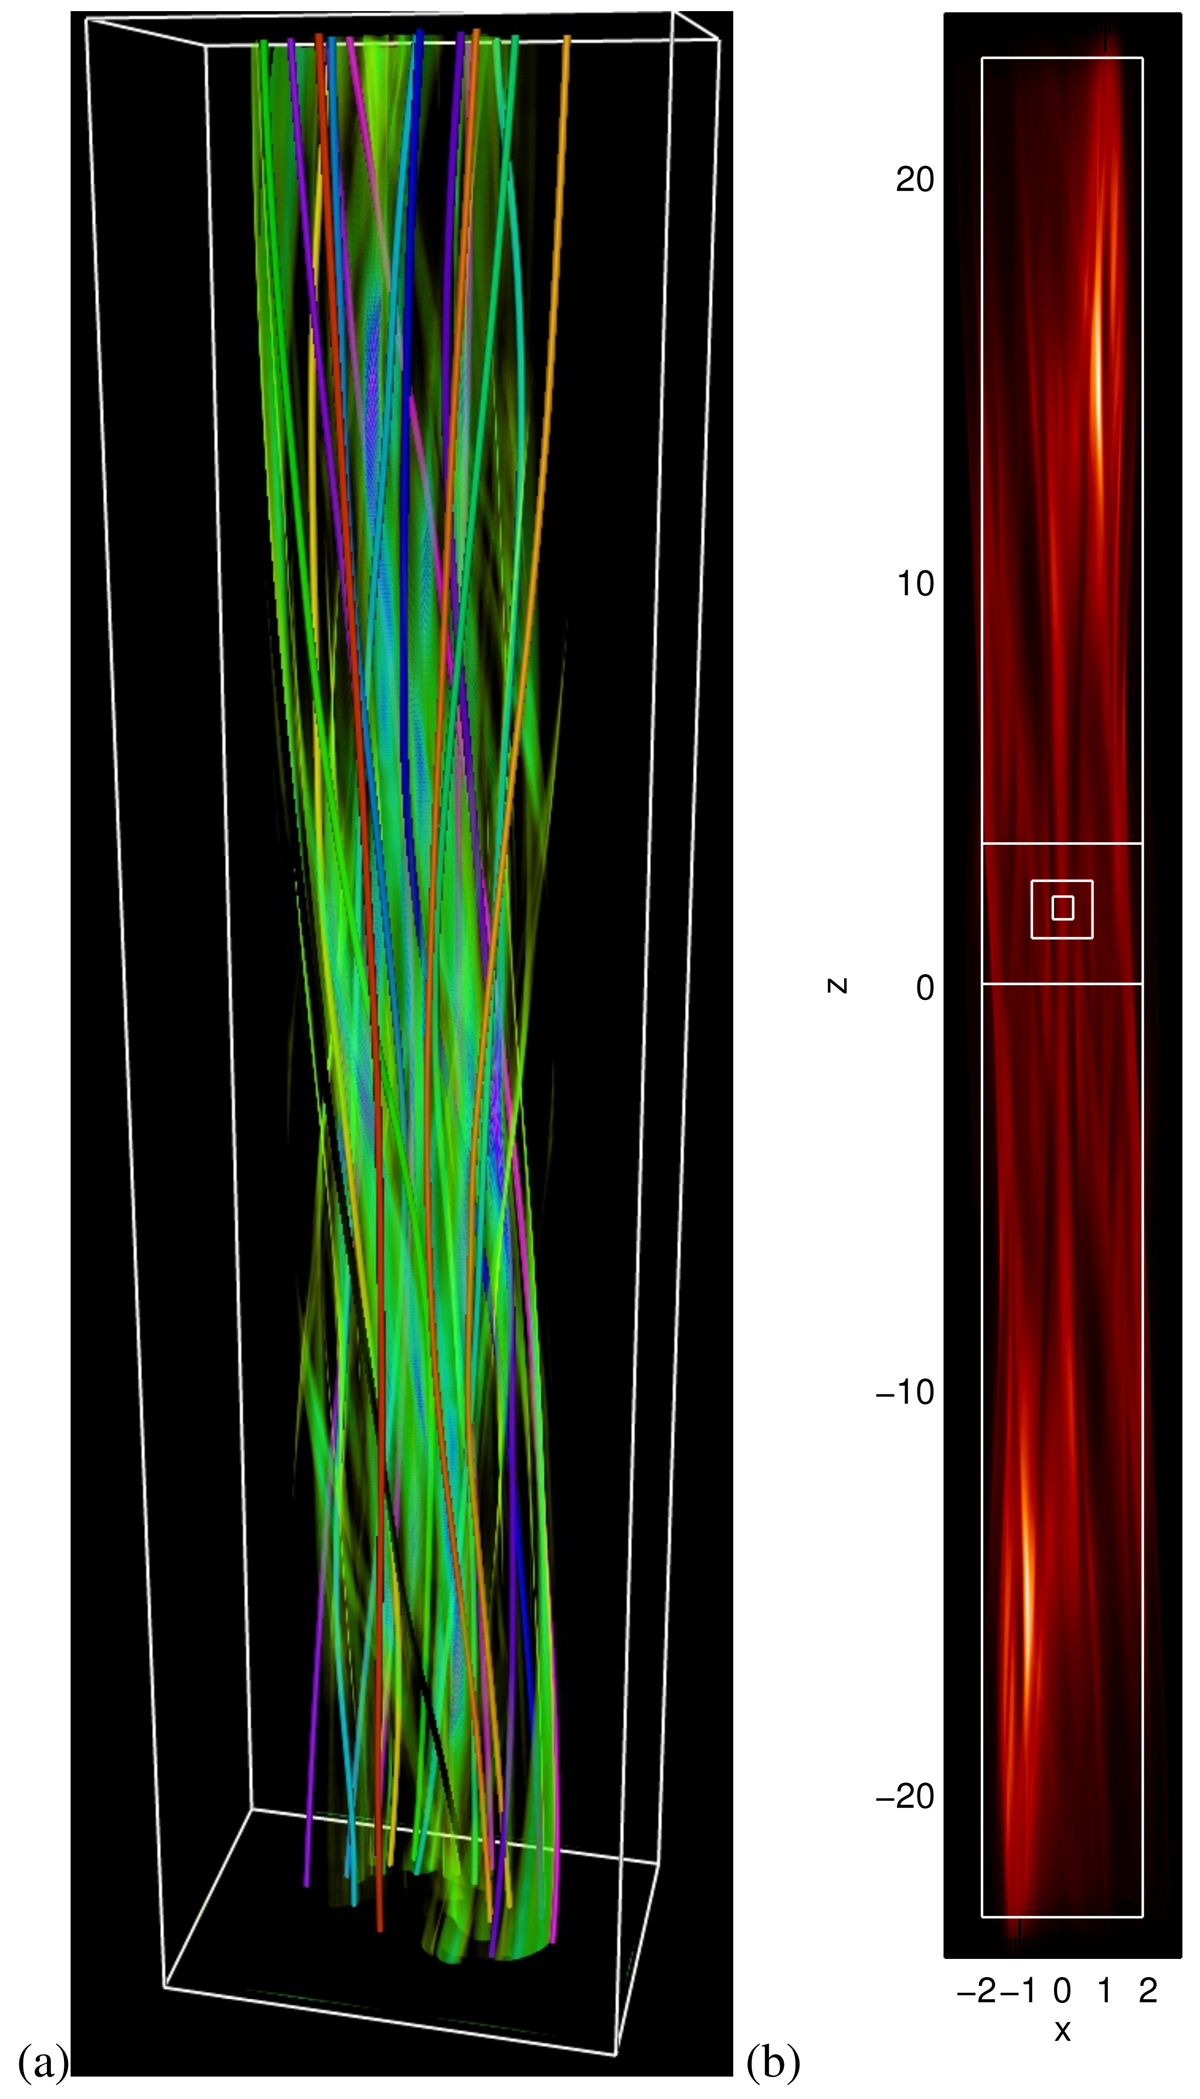
Overview of the modelled coronal loop. (a) Volume rendering of the modulus of the current density together with selected magnetic field lines at t = 92 s. (b) Synthesised Fe XII emission for the whole loop with LOS along y. Over-plotted are boxes showing the fields-of-view used in Fig. 4. Axis markers are in Mm and the intensity is normalised to 1.
Current usage metrics show cumulative count of Article Views (full-text article views including HTML views, PDF and ePub downloads, according to the available data) and Abstracts Views on Vision4Press platform.
Data correspond to usage on the plateform after 2015. The current usage metrics is available 48-96 hours after online publication and is updated daily on week days.
Initial download of the metrics may take a while.