Fig. 6
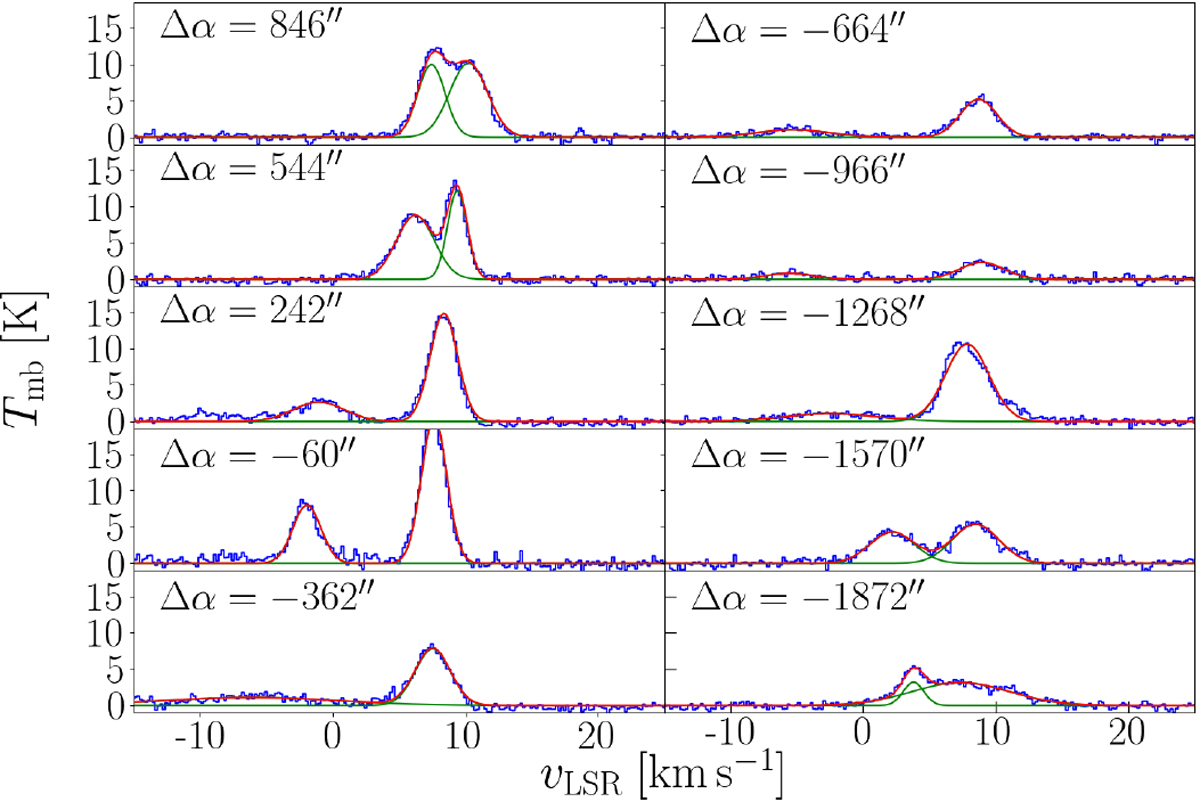
[C II] spectra in the Veil shell taken from pv diagram in Fig. 5 with Gaussian fits. Spectra at Δα = −362′′ to Δα = −1268′′ are averaged over 151′′ × 75.5′′ in order toimprove the signal-to-noise ratio of the faint shell component to be fitted, others are averaged over 75.5′′ × 75.5′′. Coordinate offsets indicate the lower left-hand corner of the rectangle over which the spectra are averaged; Δδ = −907′′. The fit parameters are given in Table 1.
Current usage metrics show cumulative count of Article Views (full-text article views including HTML views, PDF and ePub downloads, according to the available data) and Abstracts Views on Vision4Press platform.
Data correspond to usage on the plateform after 2015. The current usage metrics is available 48-96 hours after online publication and is updated daily on week days.
Initial download of the metrics may take a while.