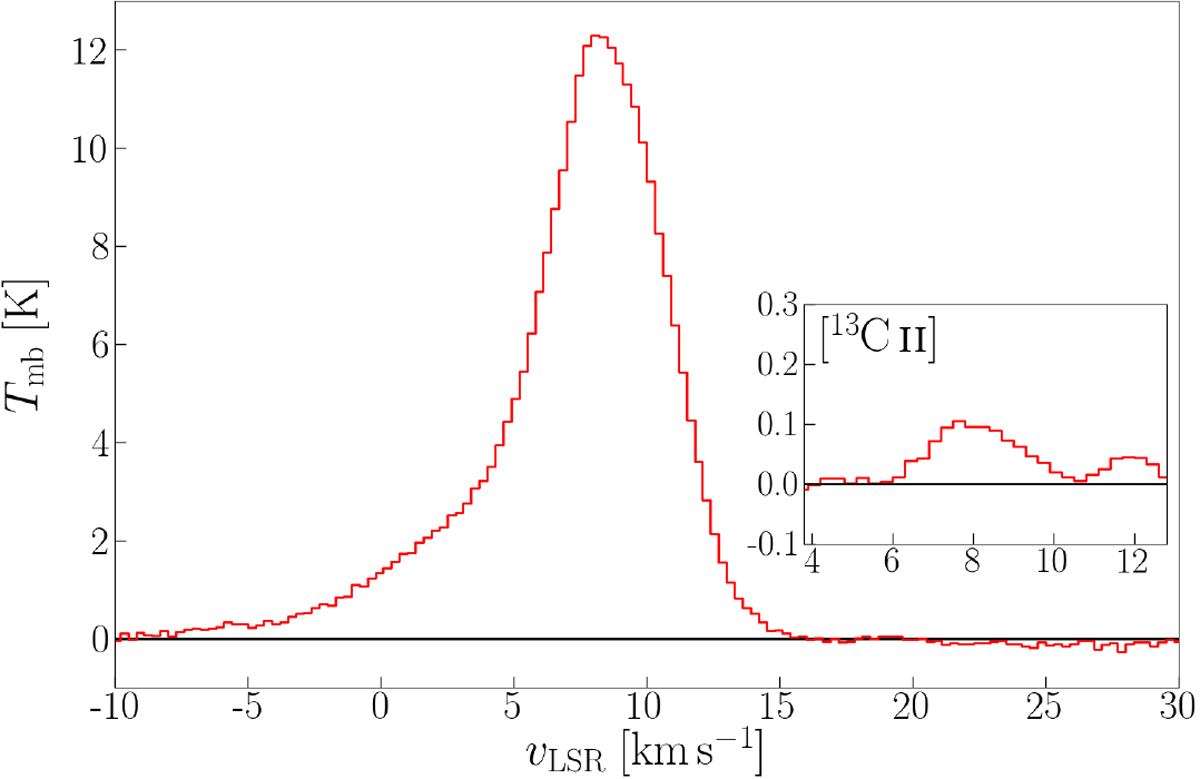
Fig. 3

Average [C II] spectrum towards the Veil shell without OMC1 and ISF. The inlaid panel shows the residual of the spectrum, in the systemic velocity of the [13C II] F = 2 − 1 line, after subtracting the [12C II] fit. The [12C II] line can be fitted by two Gaussians with TP ≃ 11.2 ± 0.3 K, vP ≃ 8.8 ± 0.1 km s−1, ΔvFWHM ≃ 5.0 ± 0.1 km s−1 and TP≃ 2.3 ± 0.1 K, vP ≃ 4.0 ± 0.4 km s−1, ΔvFWHM ≃ 9.3 ± 0.5 km s−1; the [13C II] F = 2 − 1 component is fitted by a Gaussian with TP ≃ 0.11 ± 0.02 K, vP ≃ 8.2 ± 0.3 km s−1, ΔvFWHM ≃ 2.1 ± 0.6 km s−1. The main line could also be fitted with three Gaussian components, but we compare the respective combined peak temperatures of the [12C II] and [13C II] line for a first-order estimate of the excitation conditions.
Current usage metrics show cumulative count of Article Views (full-text article views including HTML views, PDF and ePub downloads, according to the available data) and Abstracts Views on Vision4Press platform.
Data correspond to usage on the plateform after 2015. The current usage metrics is available 48-96 hours after online publication and is updated daily on week days.
Initial download of the metrics may take a while.


