Fig. B.4
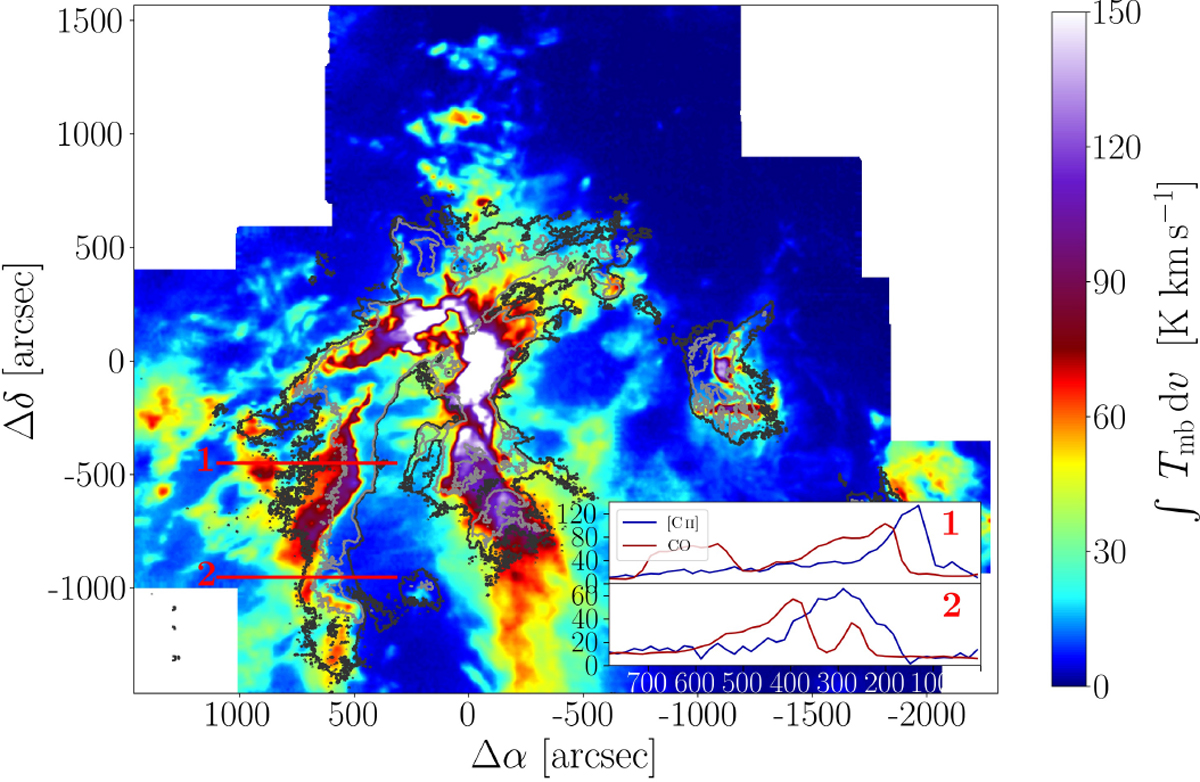
12CO(2–1) emission in velocity interval vLSR = 5−8 km s−1 with [C II] emission in same velocity interval in contours (dark grey: 30 K km s−1, light grey: 50 K km s−1). The inlaid panels show the line cuts along the two red lines indicated in the figure.
Current usage metrics show cumulative count of Article Views (full-text article views including HTML views, PDF and ePub downloads, according to the available data) and Abstracts Views on Vision4Press platform.
Data correspond to usage on the plateform after 2015. The current usage metrics is available 48-96 hours after online publication and is updated daily on week days.
Initial download of the metrics may take a while.