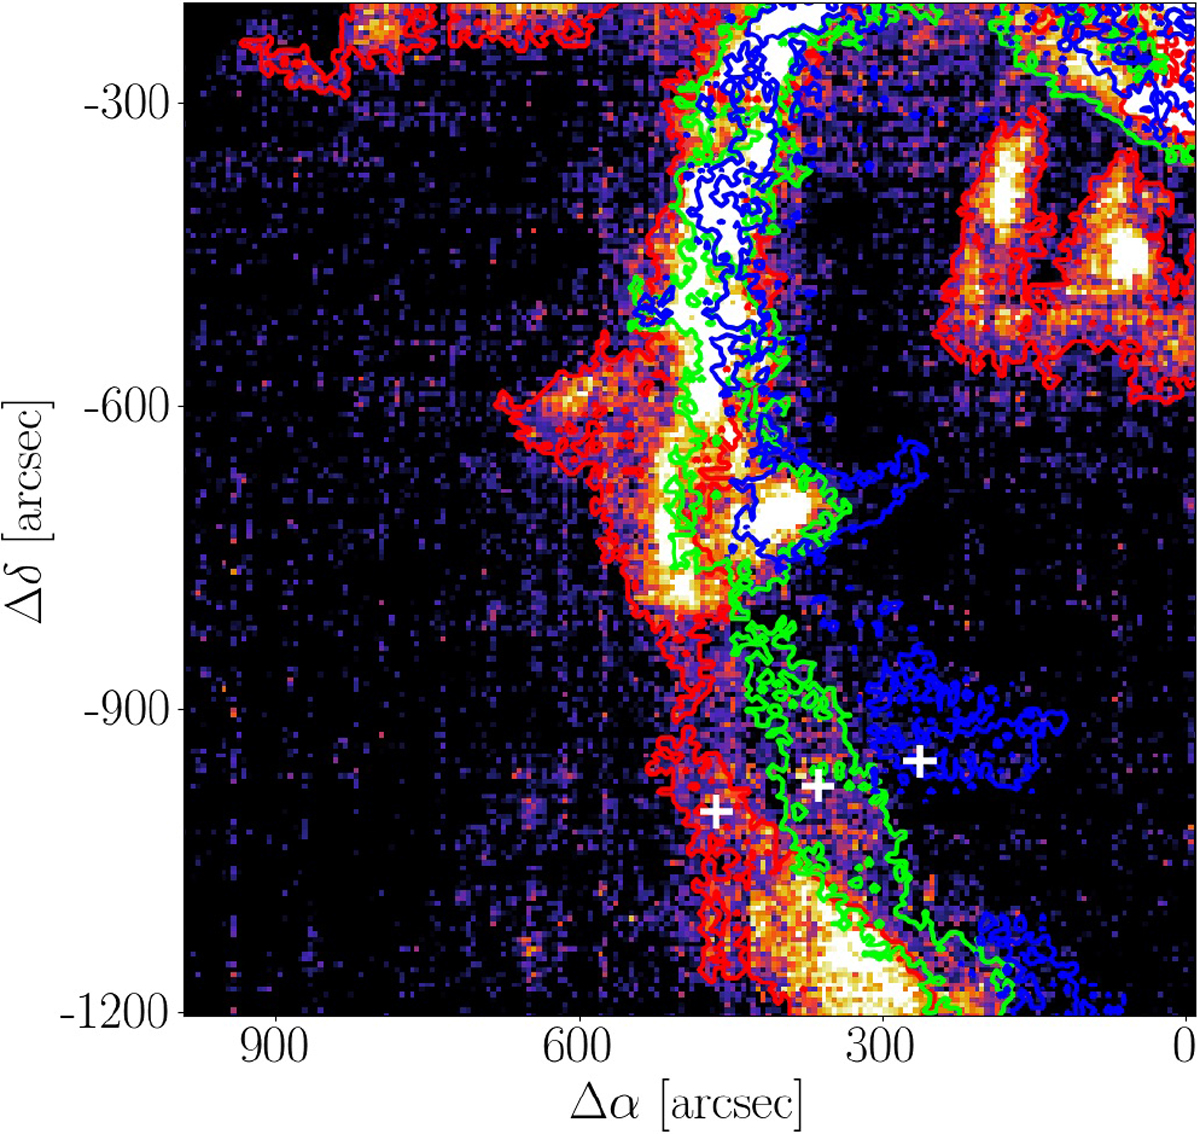
Fig. B.1

Color map of [C II] emission in velocity interval vLSR = 0−5 km s−1, with contours of the channel emission in vLSR = 0−1 km s−1, vLSR = 2−3 km s−1, and vLSR = 4−5 km s−1 (blue, green, and red, respectively). From the displacement of the structure of brightest emission in these channels with respect to each other, points marked by the white crosses, we can estimate the expansion velocity to be vexp ≃ 4.25 km s−1. The projected distance between the crosses is 0.2 pc, and the projected distance from the Trapezium stars of the outermost filament, traced by blue contours, is 1.75 pc.
Current usage metrics show cumulative count of Article Views (full-text article views including HTML views, PDF and ePub downloads, according to the available data) and Abstracts Views on Vision4Press platform.
Data correspond to usage on the plateform after 2015. The current usage metrics is available 48-96 hours after online publication and is updated daily on week days.
Initial download of the metrics may take a while.


