Fig. A.1
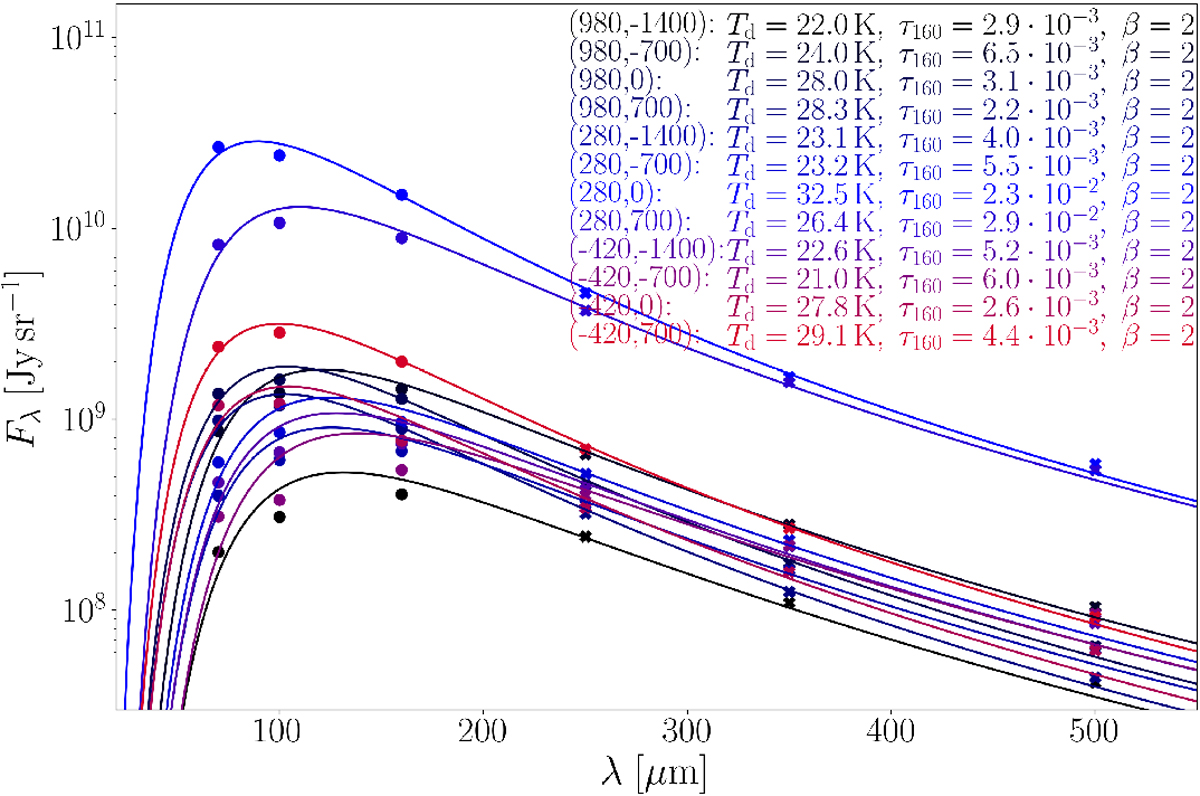
SED fits to individual points throughout the Orion Nebula complex. The flux in the PACS bands is plotted as circles; fluxes of the SPIRE bands are plotted as crosses. Numbers in brackets are the RA and Dec offset, respectively, in arc seconds.
Current usage metrics show cumulative count of Article Views (full-text article views including HTML views, PDF and ePub downloads, according to the available data) and Abstracts Views on Vision4Press platform.
Data correspond to usage on the plateform after 2015. The current usage metrics is available 48-96 hours after online publication and is updated daily on week days.
Initial download of the metrics may take a while.