Fig. 2
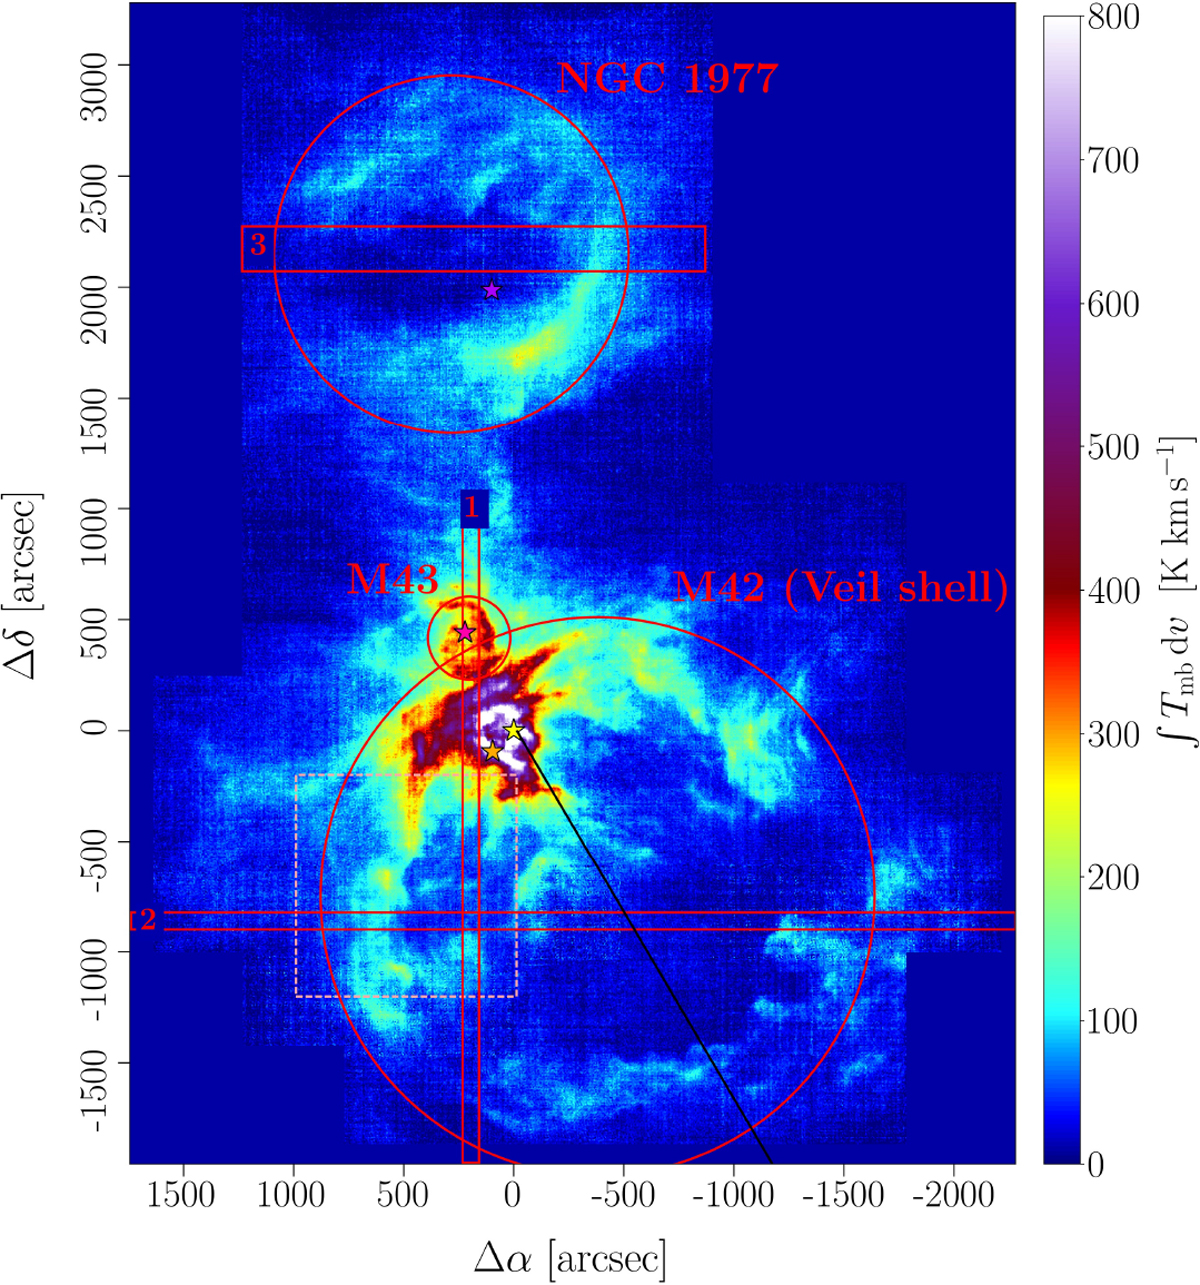
[C II] line-integrated intensity from the Orion Nebula (M 42), M 43, and NGC 1977. The red rectangles 1 and 2 indicate the positions of the pv diagrams shown in Figs. 5 (horizontal) and 8 (vertical). Rectangle 3 indicates the position of the pv diagram shown in Fig. 17. The red circles delineate the approximate extent of the expanding bubbles of gas that are the Veil shell, M 43, and NGC 1977, and within which the respective masses and luminosities are computed. The light-red dashed rectangle circumscribes the area of the eastern bright arm shown in Figs. B.1 and B.2. The black line indicates the position of the line cut in Fig. 4. The stars mark the position of θ1 Ori C (yellow), θ2 Ori A (orange), NU Ori (pink), and 42 Orionis (purple). Unless noted otherwise, all coordinate offsets are given with respect to the position of θ1 Ori C, (α, δ) = (5h35′ 16.46′′, − 5°23′22.85′′).
Current usage metrics show cumulative count of Article Views (full-text article views including HTML views, PDF and ePub downloads, according to the available data) and Abstracts Views on Vision4Press platform.
Data correspond to usage on the plateform after 2015. The current usage metrics is available 48-96 hours after online publication and is updated daily on week days.
Initial download of the metrics may take a while.