Fig. 18
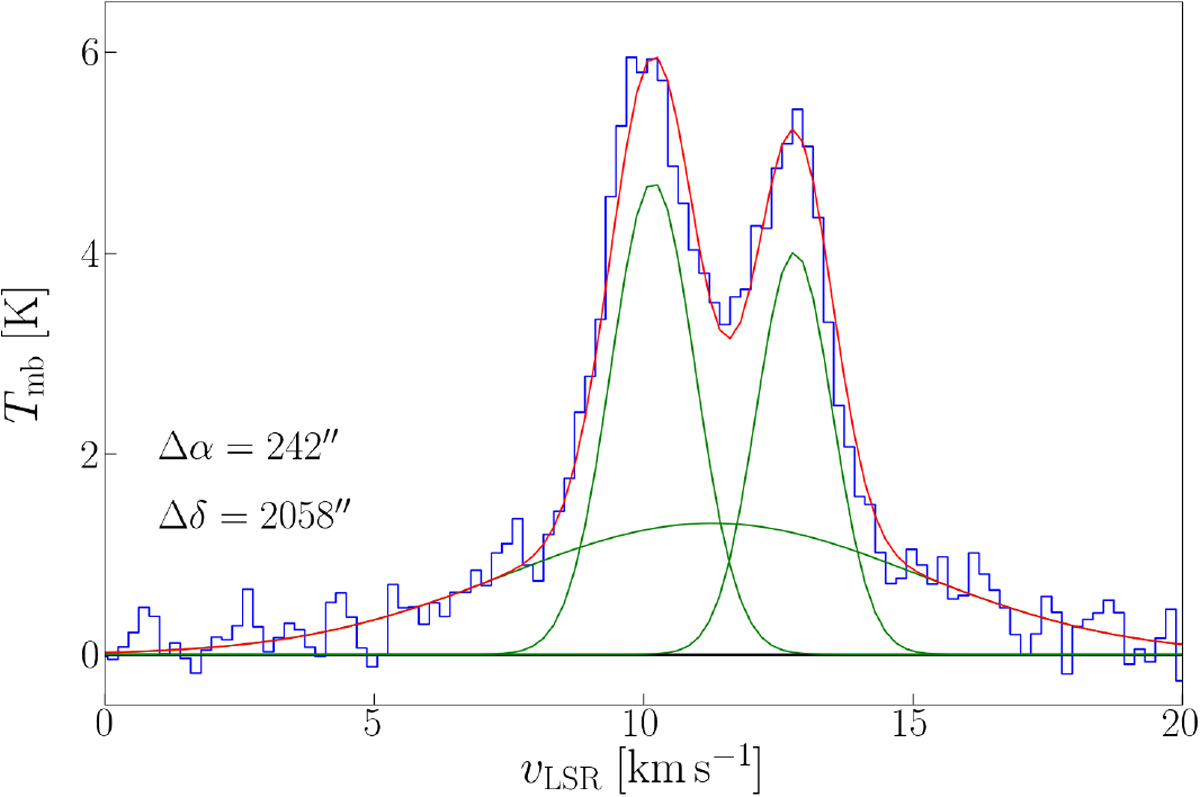
[C II] spectrum along pv diagram in NGC 1977 (Fig. 17) with Gaussian fits, averaged over 201′′ × 201′′. Coordinate offsets indicate the lower left-hand corner of the square over which the spectrum is averaged. The two narrow components stem from the expanding shell, while the broad component originates in the ionized gas that is contained within the shell. Since the bubble expands in both directions, the peak-velocity difference is twice the expansion velocity, vexp ≃ 1.3 km s−1. The fit parameters are given in Table 4.
Current usage metrics show cumulative count of Article Views (full-text article views including HTML views, PDF and ePub downloads, according to the available data) and Abstracts Views on Vision4Press platform.
Data correspond to usage on the plateform after 2015. The current usage metrics is available 48-96 hours after online publication and is updated daily on week days.
Initial download of the metrics may take a while.