Fig. 14
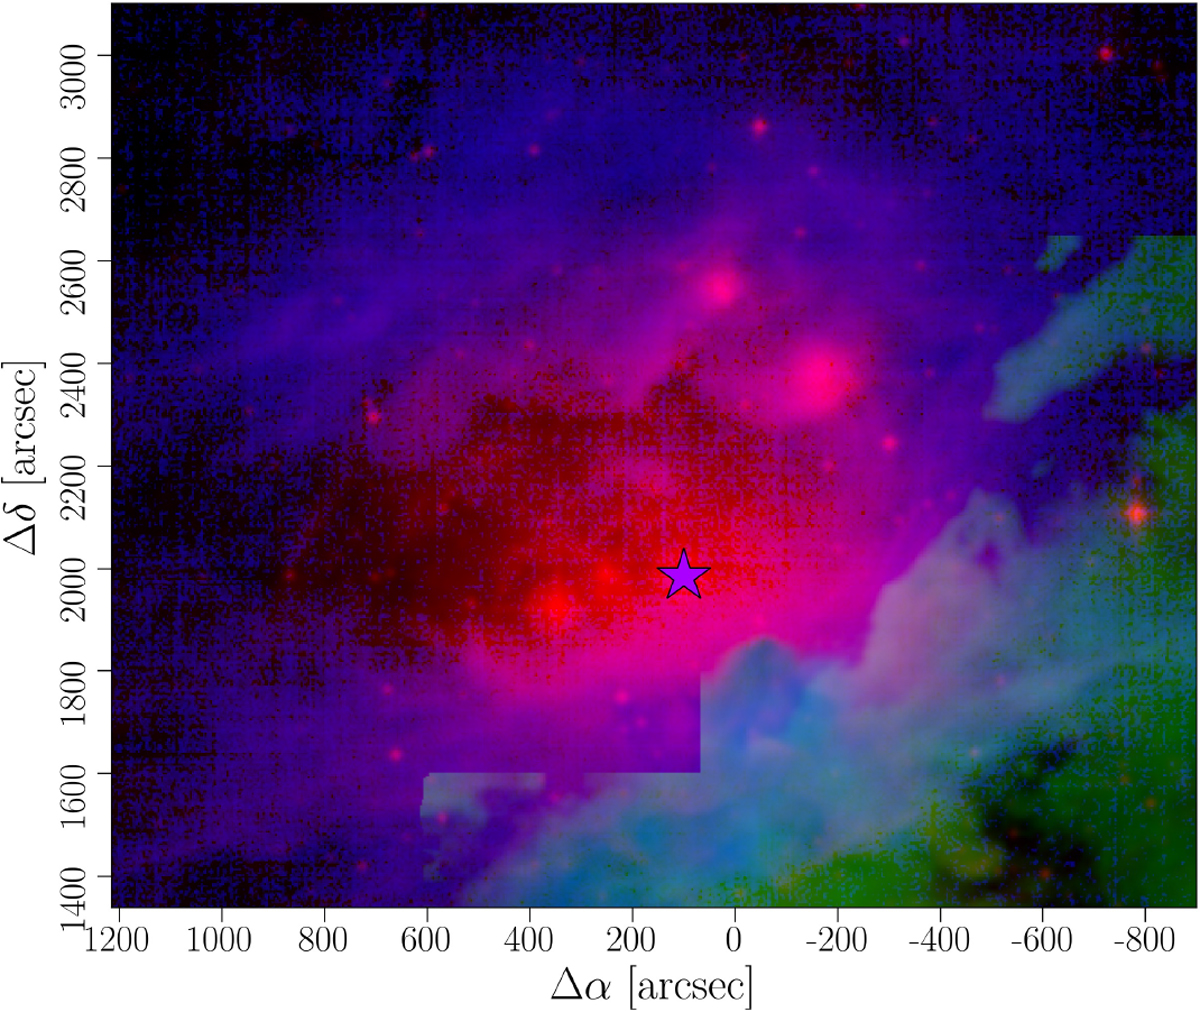
Three-color image of NGC 1977. Red is Hα emission from the ionized gas, green is line-integrated CO(2–1) emission from molecular gas (coverage only in OMC3), and blue is the [C II] line-integrated intensity, tracing the neutral gas.
Current usage metrics show cumulative count of Article Views (full-text article views including HTML views, PDF and ePub downloads, according to the available data) and Abstracts Views on Vision4Press platform.
Data correspond to usage on the plateform after 2015. The current usage metrics is available 48-96 hours after online publication and is updated daily on week days.
Initial download of the metrics may take a while.