Fig. 13
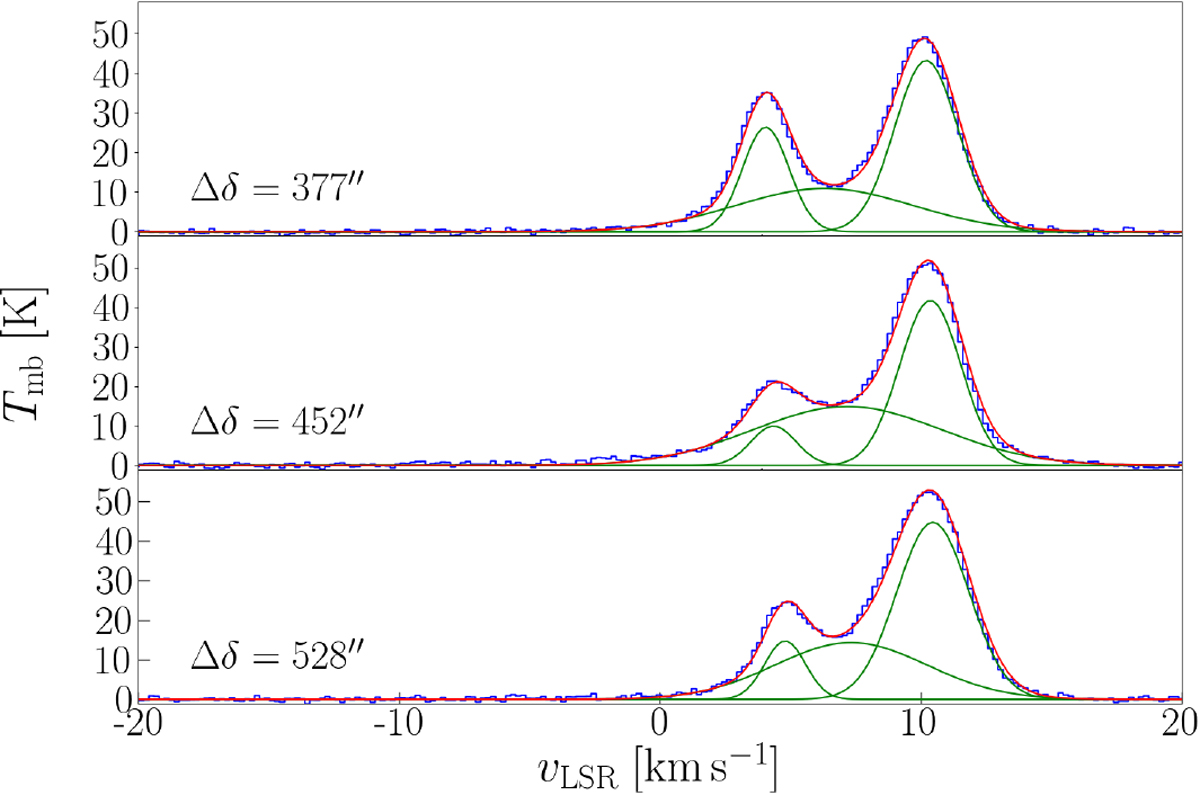
[C II] spectra along position cut 1 (cf. Fig. 12) in M 43 with Gaussian fits. Each spectrum is averaged over 75.5′′ × 25.2′′. The expanding shell has a distinguished emission peak. Additionally to the main component and the shell component, we fit a third, broad, component, that possibly stems from the ionized gas within the shell. Coordinate offsets indicate the lower left-hand corner of the rectangle over which the spectra are averaged; Δα =242′′. The fit parameters are given in Table 2.
Current usage metrics show cumulative count of Article Views (full-text article views including HTML views, PDF and ePub downloads, according to the available data) and Abstracts Views on Vision4Press platform.
Data correspond to usage on the plateform after 2015. The current usage metrics is available 48-96 hours after online publication and is updated daily on week days.
Initial download of the metrics may take a while.