Fig. 1.
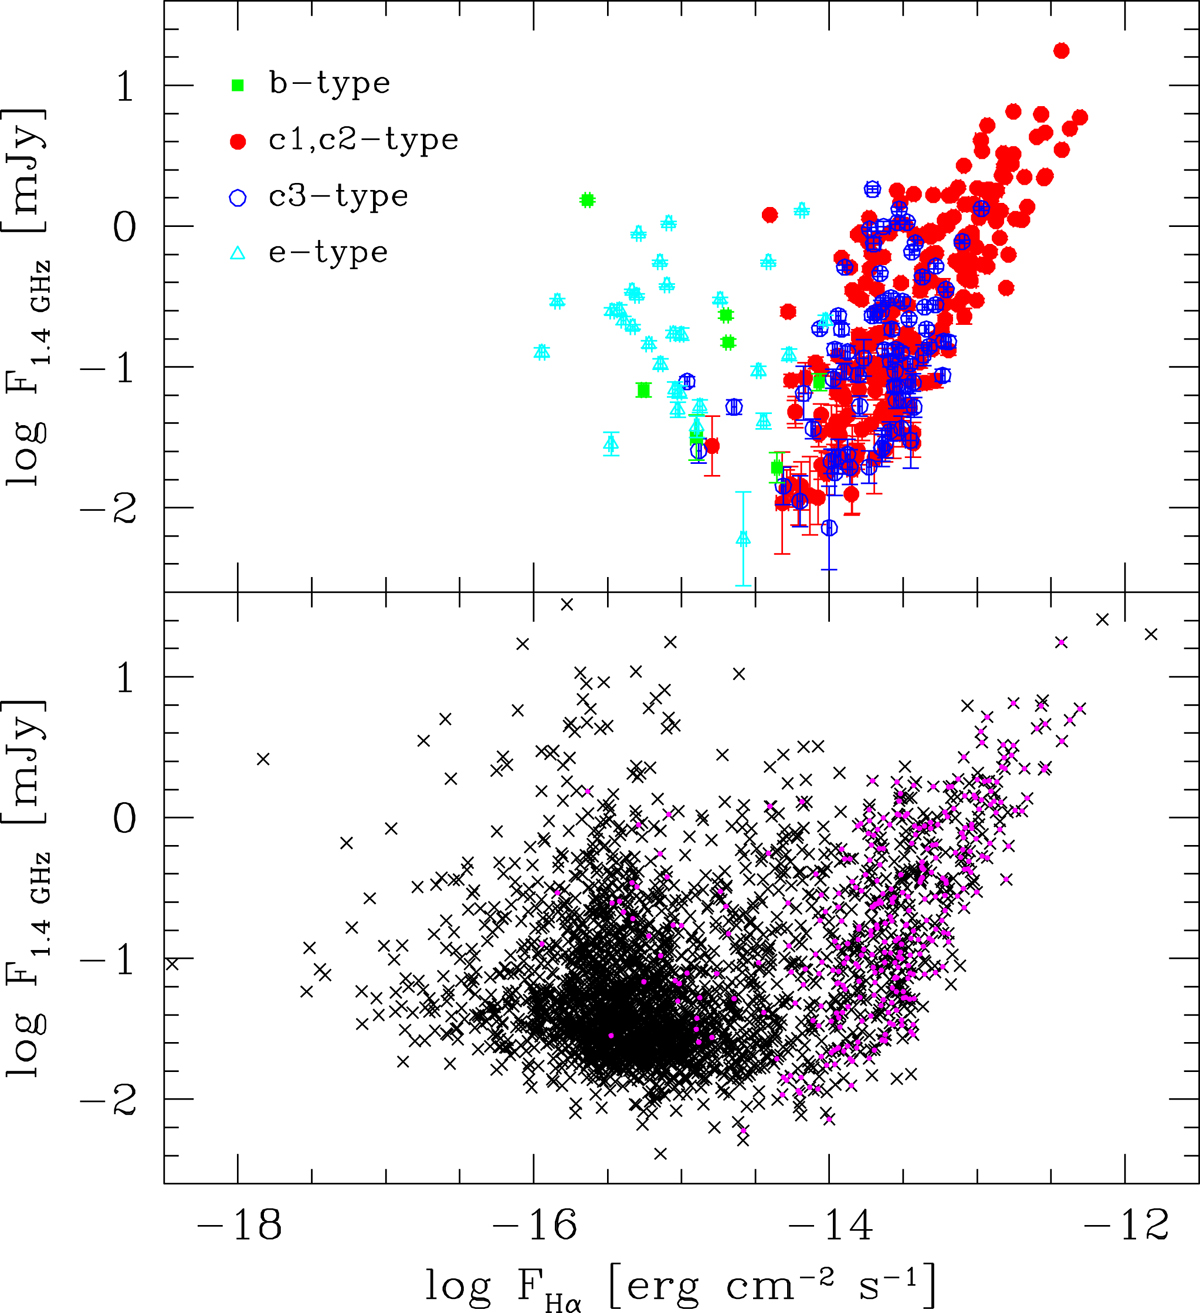
Bottom panel: radio flux at 1.4 GHz of sources in the White et al. (2019) catalog vs. the associated Hα flux in the same catalog. Magenta color highlights sources in the radio catalog which are associated with MIR sources in the catalog of Sharma et al. (2011). Top panel: sources in the radio catalog which are associated with MIR sources hosted by known GMCs (filled green and red symbols) and not associated with known GMCs (open blue and cyan symbols). The color coding, as indicated in the upper left corner, outlines the classification scheme of Corbelli et al. (2017) (see text for details), with blue and red colors marking MIR sources with a clear counterpart in Hα (c-type).
Current usage metrics show cumulative count of Article Views (full-text article views including HTML views, PDF and ePub downloads, according to the available data) and Abstracts Views on Vision4Press platform.
Data correspond to usage on the plateform after 2015. The current usage metrics is available 48-96 hours after online publication and is updated daily on week days.
Initial download of the metrics may take a while.