Fig. 5.
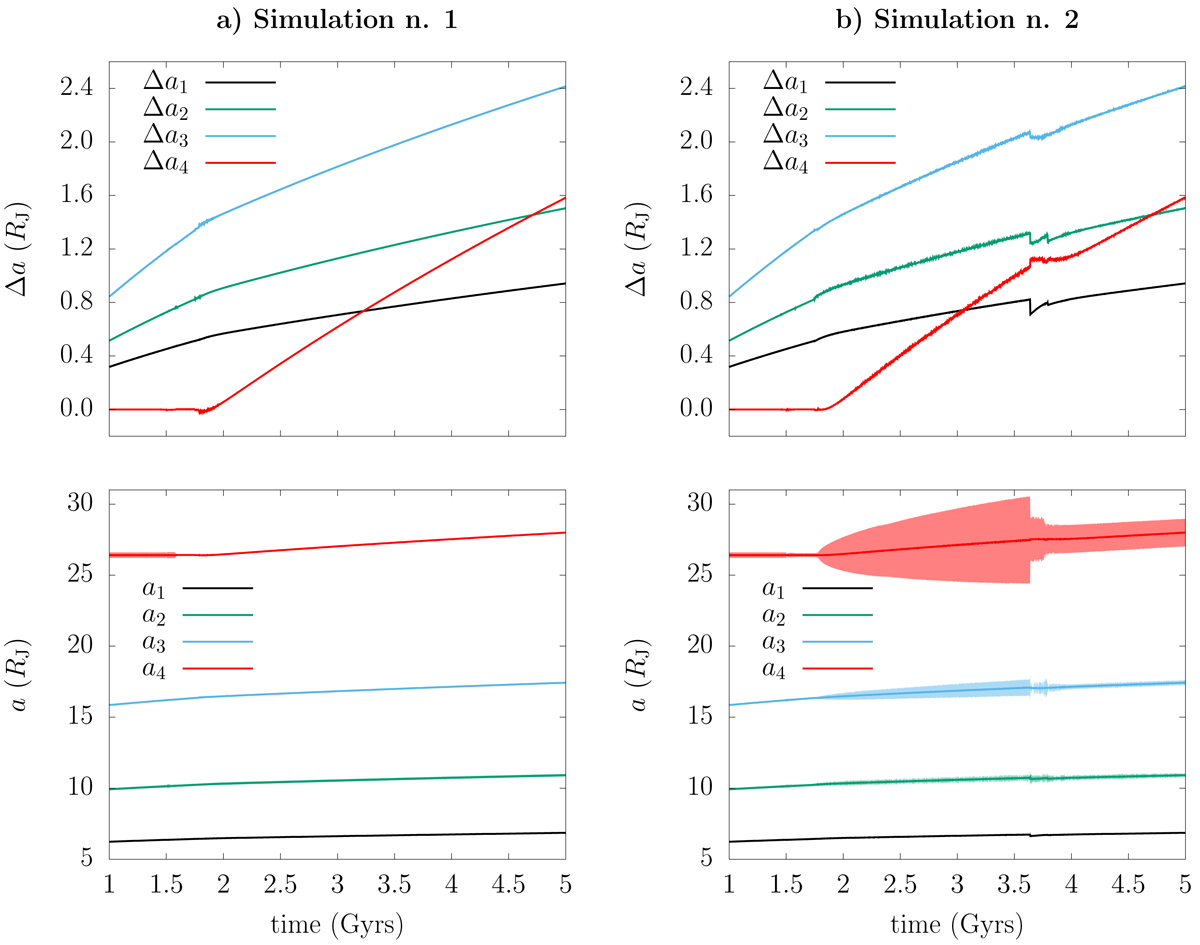
Typical long-term evolution of the semi-major axes (Δa and a). The bottom graphs also show the pericenter and apocenter distances, represented as a colored interval around the value of a. Left column: stable case where, after the first capture of Callisto into resonance, the system remains in the same configuration and the migration of the satellites is almost linear. Right column: unstable case where, at about 3.5 Gyr after time J2000, one of the resonances is disrupted and a new one is formed.
Current usage metrics show cumulative count of Article Views (full-text article views including HTML views, PDF and ePub downloads, according to the available data) and Abstracts Views on Vision4Press platform.
Data correspond to usage on the plateform after 2015. The current usage metrics is available 48-96 hours after online publication and is updated daily on week days.
Initial download of the metrics may take a while.