Table 3.
Residual maps of the lens modelling, i.e. normalized χ2 per pixel.
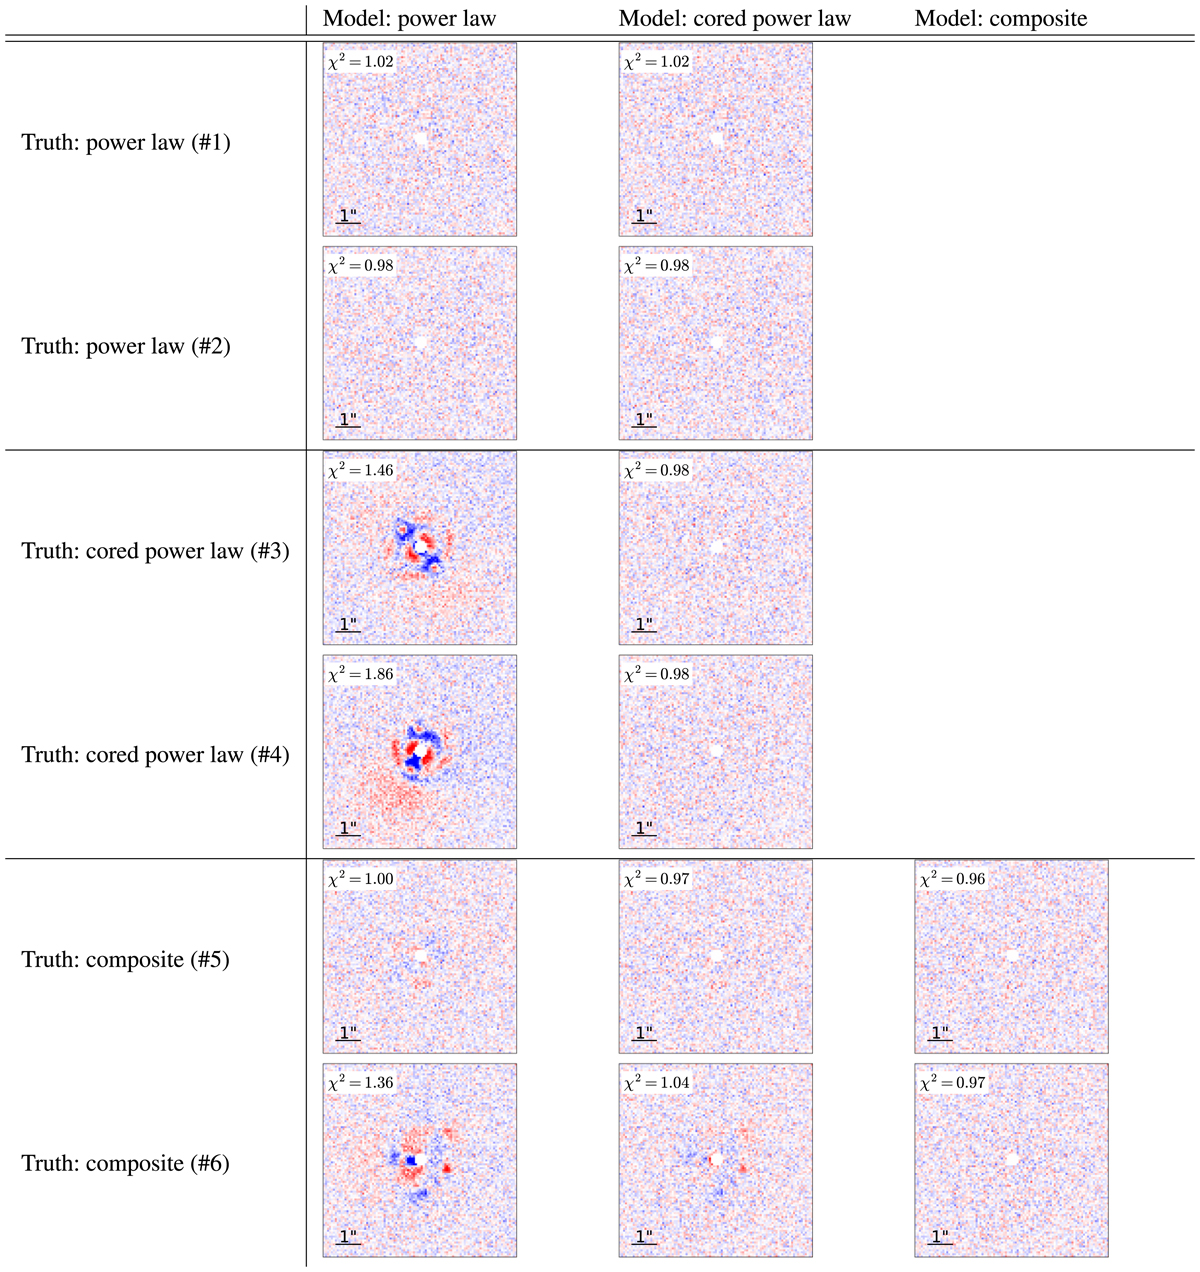
Notes. The maps corresponds to (fmodel − fdata)/σ, where fdata is the observed flux, fmodel is the modelled flux and σ is the estimated rms noise level at the pixel position. The color map ranges from −6σ (blue) to +6 σ(red). The given χ2 value in each panel is the mean χ2 per pixel and does not include the time-delay information.
Current usage metrics show cumulative count of Article Views (full-text article views including HTML views, PDF and ePub downloads, according to the available data) and Abstracts Views on Vision4Press platform.
Data correspond to usage on the plateform after 2015. The current usage metrics is available 48-96 hours after online publication and is updated daily on week days.
Initial download of the metrics may take a while.