Fig. 8.
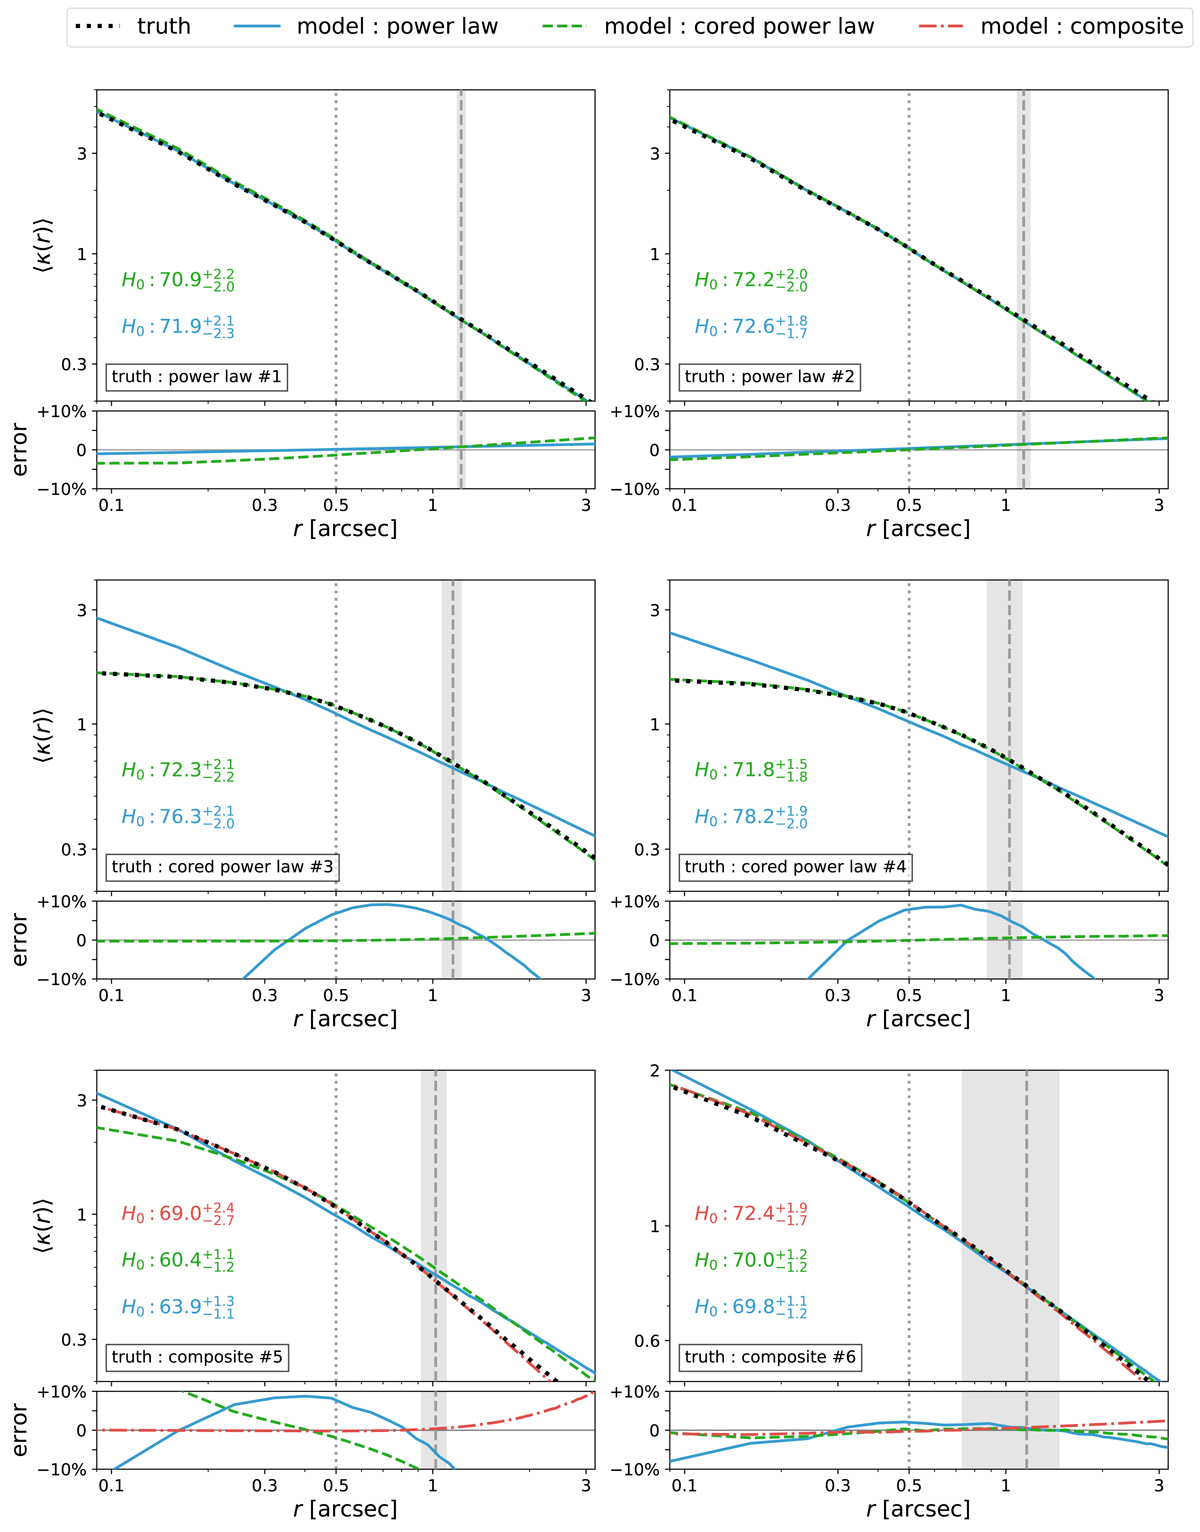
Azimuthally averaged radial convergence profiles, for the different lens models applied to fit the sample of six mock lenses (Fig. 7). Upper part of each panel: true profiles are shown in dotted lines; power-law, cored power-law and composite models are shown in blue continuous, green dashed and red dot-dashed lines, respectively. The spectroscopic (square) aperture used for computing velocity dispersions is indicated as a vertical dotted line, and the true Einstein radius location is indicated as a vertical dashed line. The gray area encloses lensed quasar image positions. For each model, the inferred H0 values are indicated (in km s−1 Mpc−1), and must be compared to the input value ![]() . Lower part of each panel: relative error computed as (truth − model)/truth. The pixel size in the simulated images is
. Lower part of each panel: relative error computed as (truth − model)/truth. The pixel size in the simulated images is ![]() .
.
Current usage metrics show cumulative count of Article Views (full-text article views including HTML views, PDF and ePub downloads, according to the available data) and Abstracts Views on Vision4Press platform.
Data correspond to usage on the plateform after 2015. The current usage metrics is available 48-96 hours after online publication and is updated daily on week days.
Initial download of the metrics may take a while.