Fig. 4.
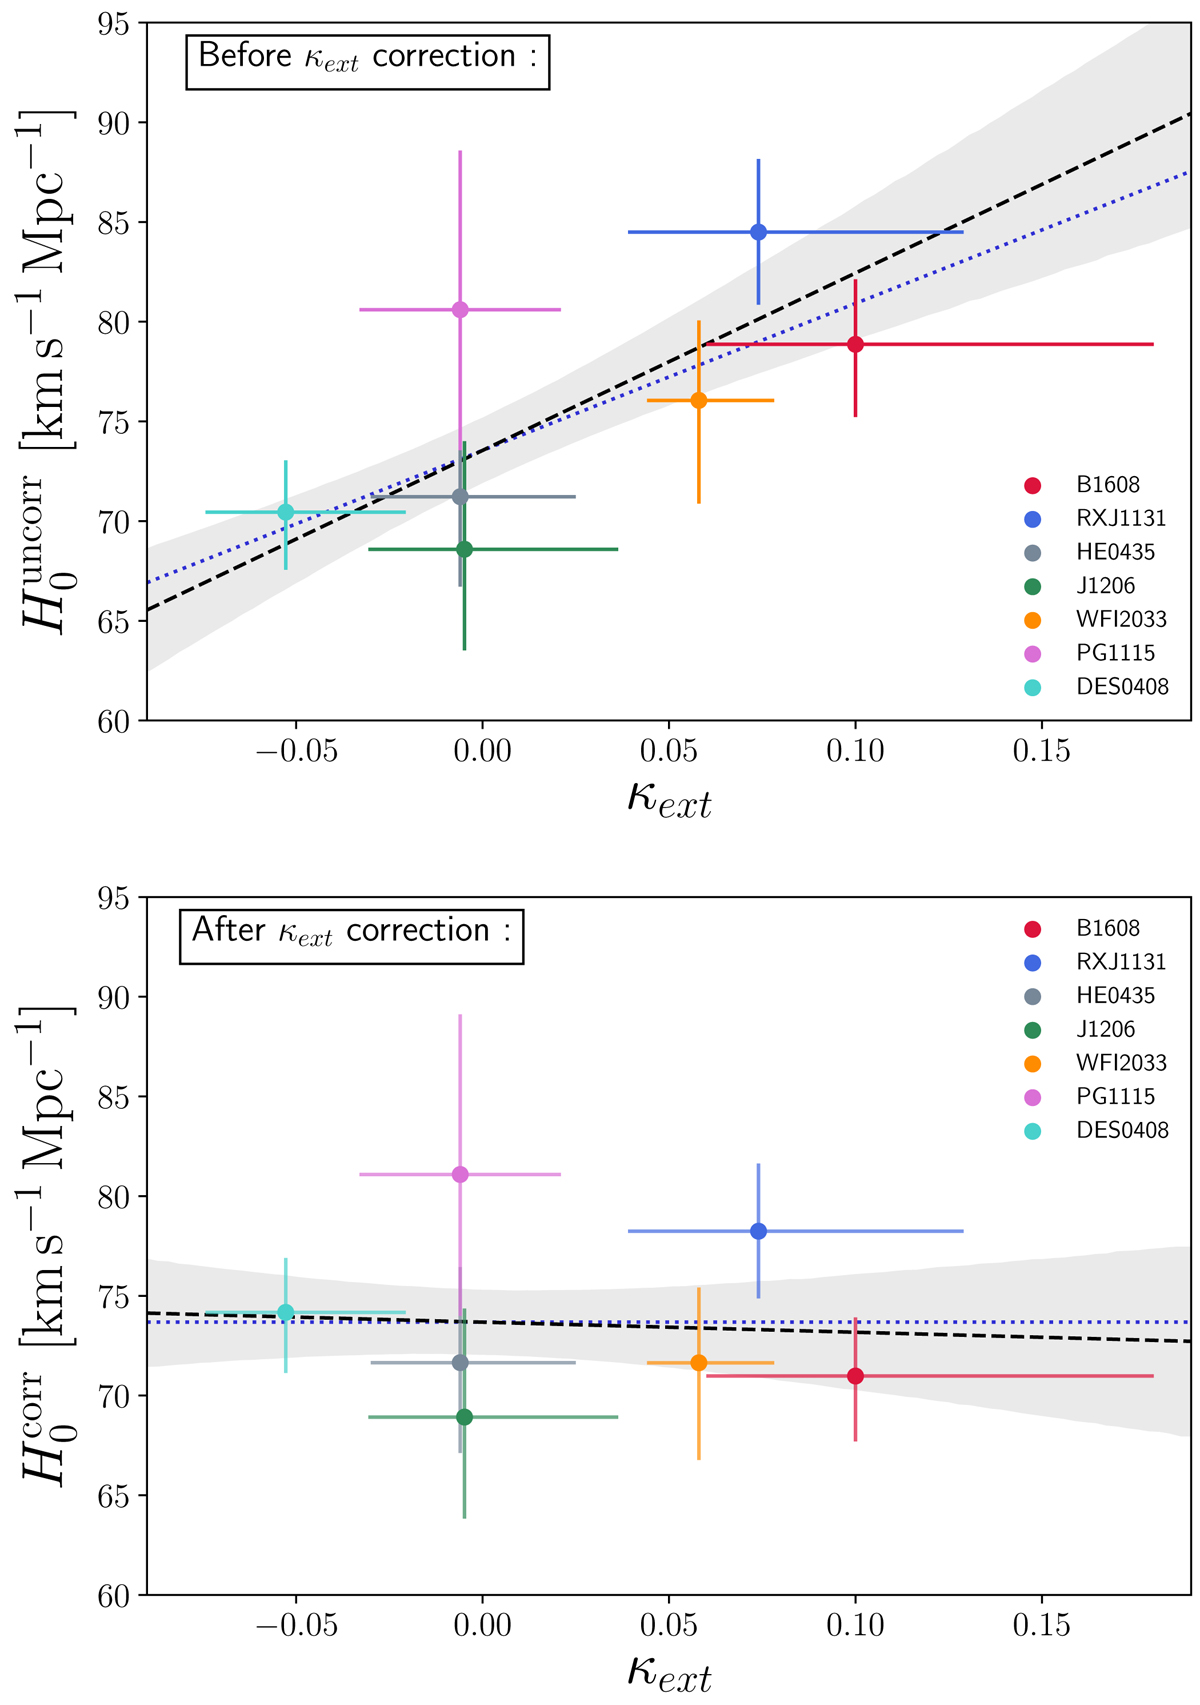
Measured Hubble constant, before (upper panel) and after (lower panel) correction for the mass along the line of sight as a function of the estimated external convergence. ![]() and
and ![]() are related according to Eq. (16). The dashed black lines show the best linear fit, and the shaded gray envelopes correspond to the 1σ uncertainties. The dotted blue lines represent the relation expected from the theory between
are related according to Eq. (16). The dashed black lines show the best linear fit, and the shaded gray envelopes correspond to the 1σ uncertainties. The dotted blue lines represent the relation expected from the theory between ![]() ,
, ![]() and κext.
and κext.
Current usage metrics show cumulative count of Article Views (full-text article views including HTML views, PDF and ePub downloads, according to the available data) and Abstracts Views on Vision4Press platform.
Data correspond to usage on the plateform after 2015. The current usage metrics is available 48-96 hours after online publication and is updated daily on week days.
Initial download of the metrics may take a while.