Fig. 1.
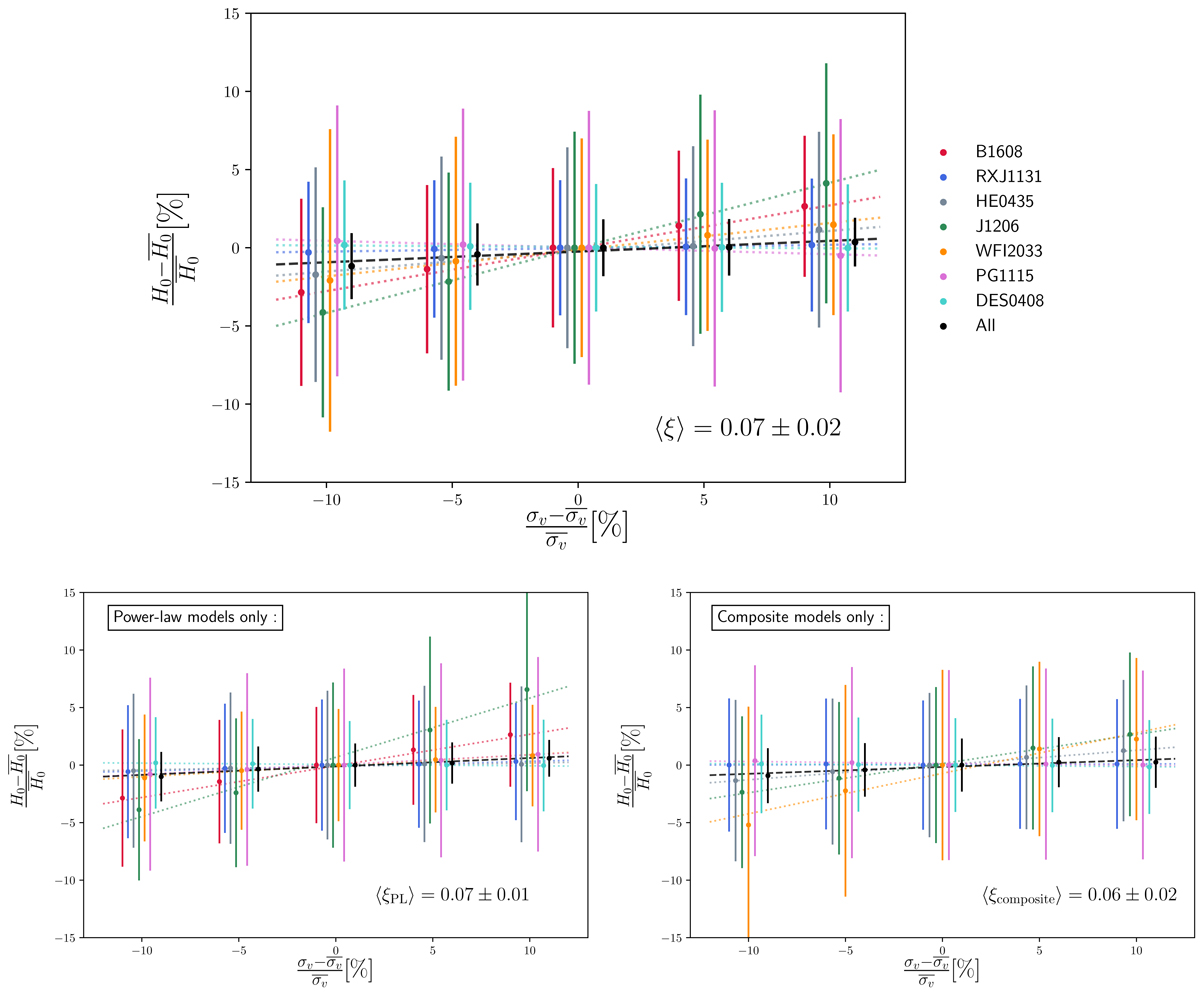
Sensitivity of the inferred Hubble constant as a function of fractional change in the measured lens velocity dispersion, σv (see Eq. (15)). Each color corresponds to one of the seven strong lens systems of the current TDCOSMO sample. The dotted lines display the best linear fit to the data. The joint inference performed on the seven lenses is shown in black. The error bars correspond to the 16th and 84th percentile of the posterior distributions. The two bottom panels show the sensitivity of H0 to a change in the measured lens velocity dispersion for power-law (left) and composite (right) models independently. The sensitivity of the joint inference, ⟨ξ⟩ is indicated on each panel.
Current usage metrics show cumulative count of Article Views (full-text article views including HTML views, PDF and ePub downloads, according to the available data) and Abstracts Views on Vision4Press platform.
Data correspond to usage on the plateform after 2015. The current usage metrics is available 48-96 hours after online publication and is updated daily on week days.
Initial download of the metrics may take a while.