Fig. 9.
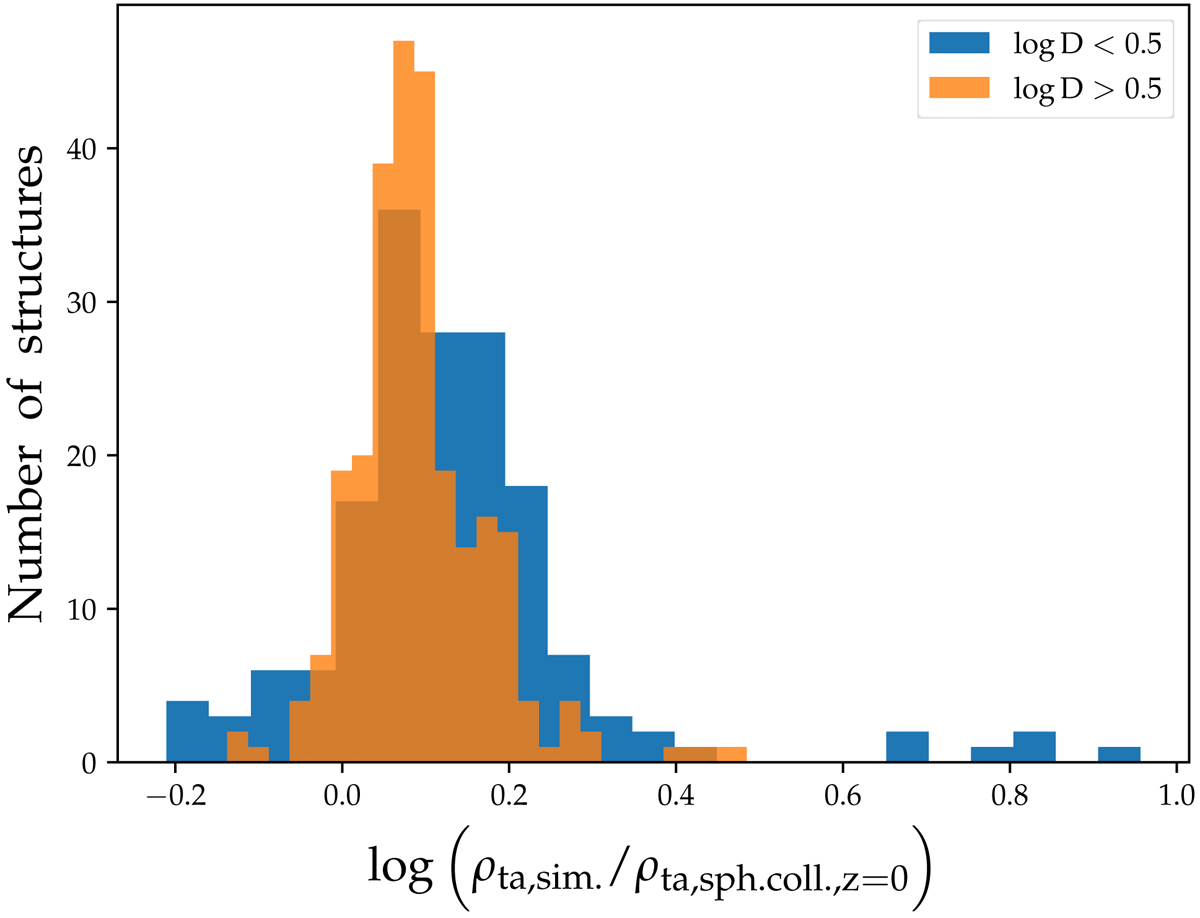
Histogram of the logarithmic difference between ρta measured in TNG-300-2 halos and the predictions of spherical collapse. Blue histogram: halos with strong tidal effects from their environment (log D < 0.5). Orange histogram: halos with smaller tidal effects (log D ≥ 0.5). The medians of the two distributions are clearly shifted (blue: median of 0.1; orange: median of 0.08.
Current usage metrics show cumulative count of Article Views (full-text article views including HTML views, PDF and ePub downloads, according to the available data) and Abstracts Views on Vision4Press platform.
Data correspond to usage on the plateform after 2015. The current usage metrics is available 48-96 hours after online publication and is updated daily on week days.
Initial download of the metrics may take a while.