Fig. 8.
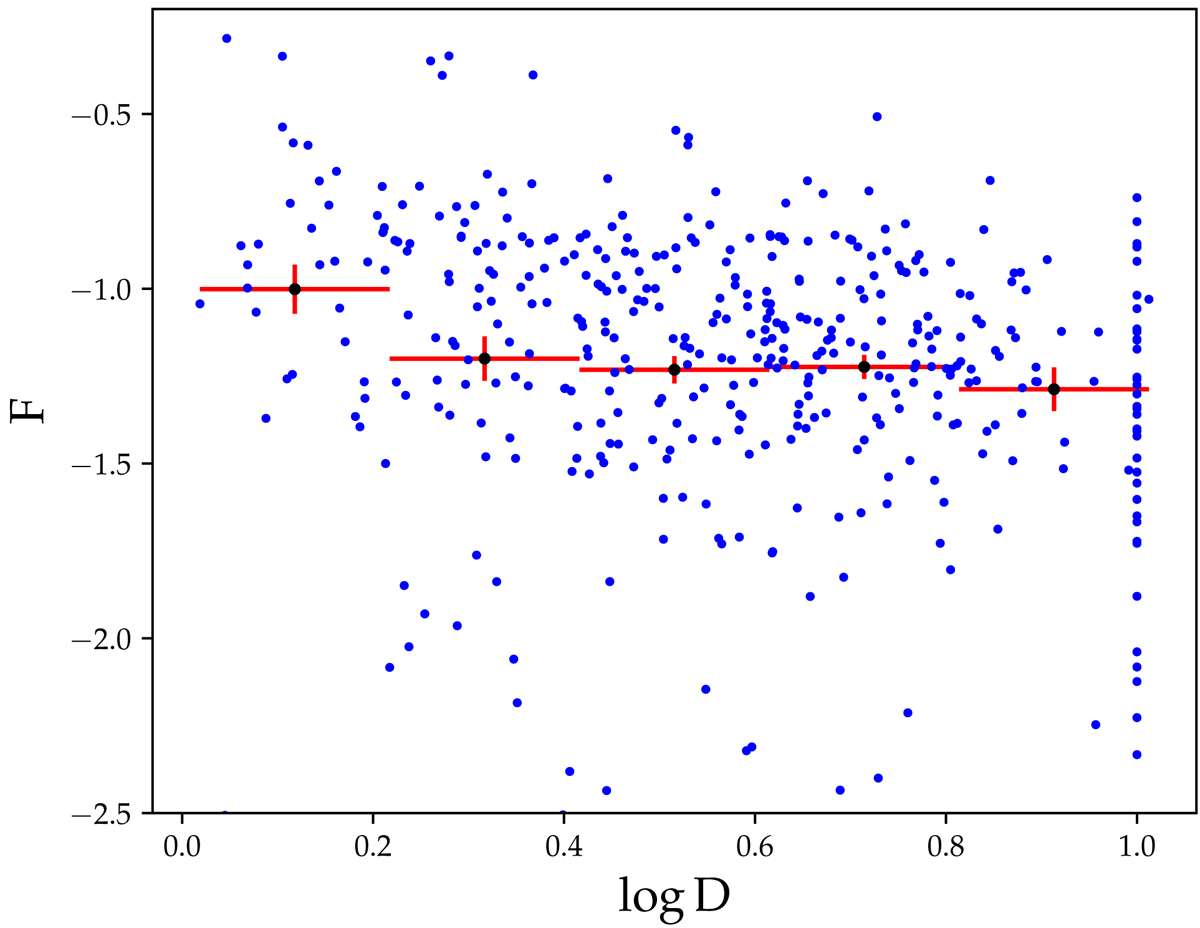
Fractional deviation of Rta from the value predicted by spherical collapse for a structure of identical enclosed mass at z = 0, plotted against the tidal parameter D (see text). Lower values of D correspond to a stronger tidal force. A moderately strong (Spearman coefficient −0.22) but very significant (p-value 10−5) correlation can be seen. The red data points correspond to the mean and standard error of the mean for the depicted bins in log D.
Current usage metrics show cumulative count of Article Views (full-text article views including HTML views, PDF and ePub downloads, according to the available data) and Abstracts Views on Vision4Press platform.
Data correspond to usage on the plateform after 2015. The current usage metrics is available 48-96 hours after online publication and is updated daily on week days.
Initial download of the metrics may take a while.