Fig. 5.
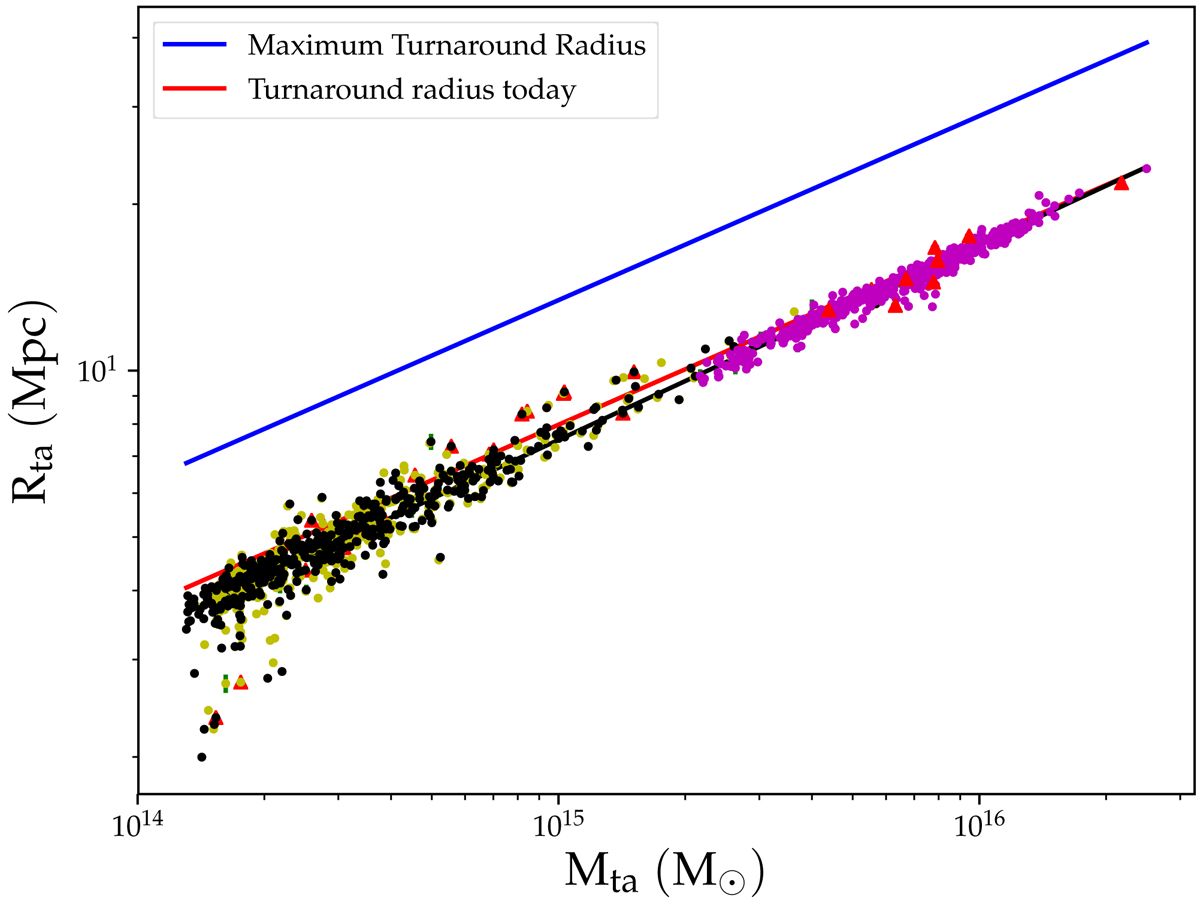
Turnaround radius as a function of enclosed mass. Black points: TNG-300-2 halos; yellow points: TNG-300-3 halos; magenta points: TDSS halos. The two simulations use different cosmological parameters; TDSS data points were renormalized to scale with cosmological parameters of TNG. Blue and red lines represent theoretical predictions of the spherical collapse model for maximum (asymptotic late-time) and present-time values of turnaround radius, respectively. The black line is a power-law fit (slope: 0.353 ± 0.001).
Current usage metrics show cumulative count of Article Views (full-text article views including HTML views, PDF and ePub downloads, according to the available data) and Abstracts Views on Vision4Press platform.
Data correspond to usage on the plateform after 2015. The current usage metrics is available 48-96 hours after online publication and is updated daily on week days.
Initial download of the metrics may take a while.